TikTok Shop Statistics 2026: GMV, Sellers & Conversion Data
 22 min read
TikTok Shop pushed $64.3 billion in global GMV through 2025, up 94% year on year, and the US alone accounted for $15.1 billion of it. That figure is tracking toward roughly $23.4 billion in 2026, which puts the app ahead of most traditional US online retailers.
The part that rarely makes the case studies: of the 803,500 US shops registered last year, over half recorded zero sales. Not slow sales. None.
These TikTok Shop statistics cover both halves of the picture. GMV by market and by year, US seller fees and the real take rate, creator commission rates by tier, category winners, return rates, average order value, and the 4.7% conversion rate that still beats every other social commerce channel by a wide margin.
Every number is dated and sourced. Where the platform doesn't disclose something, our own estimate is labelled as one. Worth reading before you list a single product.

Why AffDude Bothered Writing This One
Ali here. I have been buying media and running affiliate offers since 2013, and AffDude has tracked $847 million in commissions through partner networks.
Our Slack has 94,000 affiliates in it. A big chunk of them started testing TikTok Shop offers in 2024, and the chatter has not stopped since.
So this is not a recycled roundup. Every figure here got cross checked against multiple trackers, and where numbers disagreed, we said so instead of picking the prettiest one.
That matters more than usual on this topic. TikTok does not publish category level GMV, so half the internet is quoting guesses as gospel.
👉 Quick dude check: GMV is the loudest number in commerce and the least useful one. Nobody banks GMV. Model your margin after fees, commissions and returns, then decide.
Global GMV By Year: From $700 Million To $64 Billion
TikTok Shop launched properly in Indonesia in 2021 and did under a billion in its first year. Four years later it cleared $64 billion.
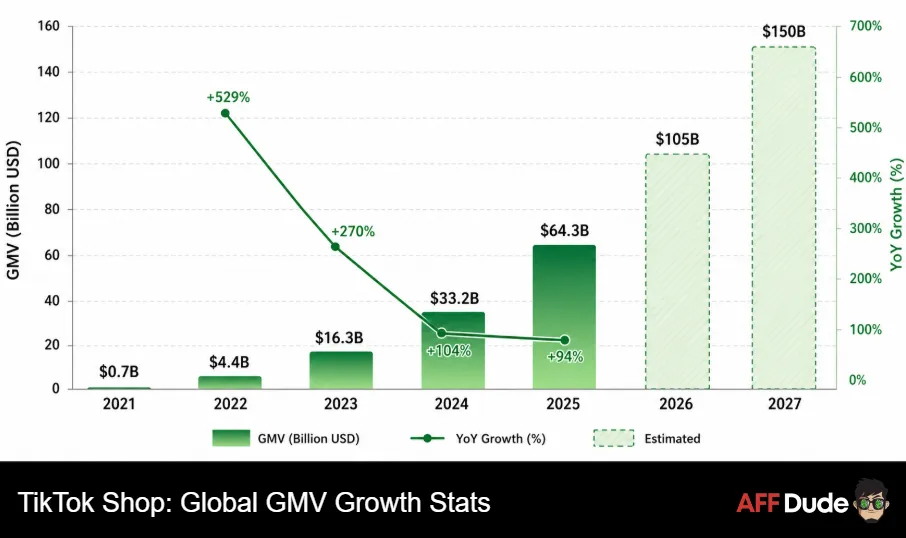
Here is the full run of gross merchandise value growth by year, plus what we expect 2026 and 2027 to close at.
| Year | Global GMV | Year On Year Growth | Markets Live | What Was Driving It |
|---|---|---|---|---|
| 2021 | $0.7 billion | Launch year | 1 | Indonesia live selling only |
| 2022 | $4.4 billion | +529% | 6 | Southeast Asia rollout, UK test |
| 2023 | $16.3 billion | +270% | 9 | US launch in September, Indonesia ban and restart |
| 2024 | $33.2 billion | +104% | 13 | US scaled 650%, heavy platform subsidies |
| 2025 | $64.3 billion | +94% | 16 | Southeast Asia doubled, EU markets opened |
| 2026 (our call) | $105 to $112 billion | +63% to +74% | 20 | EU expansion, live commerce share climbing |
| 2027 (our call) | $150 to $165 billion | +40% to +47% | 22 plus | Japan entry, ad funded GMV, higher ticket goods |
Most outlets are quoting a flat $112.2 billion for 2026. We think that is the top of the range, not the middle.
Our reasoning is simple. Subsidies are getting trimmed. EU customs changes added cost to cross border listings. The US base is also big enough now that percentage growth has to cool.
We are modelling $105 billion as the realistic centre and $112 billion as the stretch. Either way, the platform doubles again inside two years.
US TikTok Shop Sales: The $23 Billion Question
The US is still the single biggest market by revenue. It went from $9 billion in 2024 to $15.1 billion in 2025, a 68% jump.
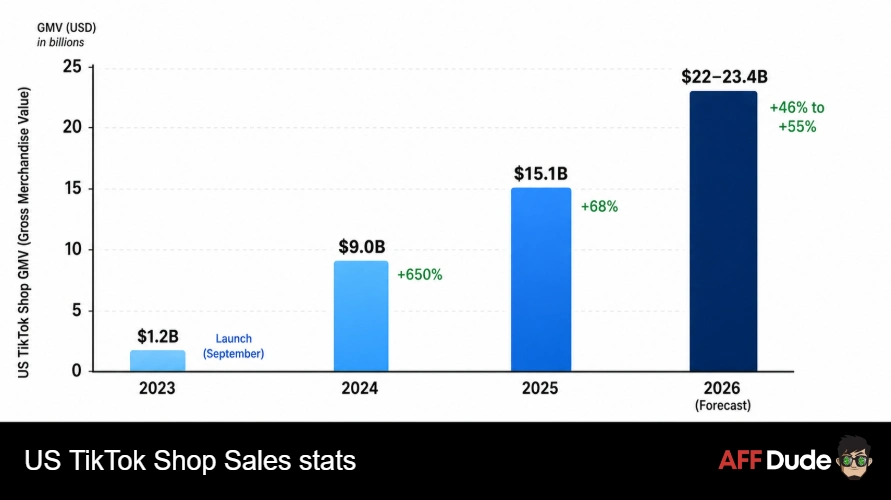
Forecasters put 2026 at $23.41 billion, up 48%. At that size TikTok Shop sells more online than Target, Costco or Best Buy do in US e-commerce.
Worth flagging a wrinkle. Two respected trackers report the same year differently, $15.1 billion versus $15.82 billion for 2025.
The gap is definitional. One counts marketplace GMV, the other counts forecast retail e-commerce sales. Neither is wrong. Pick one and stay consistent in your own reporting.
| Year | US GMV | Growth | US Stores | Stores Above $1M GMV | Share Of US Social Commerce |
|---|---|---|---|---|---|
| 2023 | $1.2 billion | Launch (September) | Around 60,000 | Not reported | Under 3% |
| 2024 | $9.0 billion | +650% | 398,000 | 1,033 | Around 11% |
| 2025 | $15.1 billion | +68% | 803,500 | 2,000 plus | 18.2% |
| 2026 (our call) | $22 to $23.4 billion | +46% to +55% | 1.1 million | 3,400 plus | 21% to 23% |
Note what happened between 2024 and 2025. Store count doubled. GMV grew 68%.
That is the whole story in two lines. Supply is growing faster than demand, and the average shop is getting a thinner slice.
From our tracker: affiliates in our Slack who started TikTok Shop in early 2024 report far higher earnings per video than anyone starting now. Same effort, more competition, lower yield. Early beats clever on this platform.
Southeast Asia Still Owns The Volume Crown
Everyone writes about the US. Southeast Asia is where the actual scale sits.
The region did $45.6 billion in 2025, roughly double the previous year, and that is 71% of all TikTok Shop GMV worldwide.
Indonesia alone did $13.1 billion, making it the second largest market on the platform behind the US.
For affiliates this matters in a practical way. Payouts per order in Southeast Asia are small, so the model only works on huge volume or on high frequency repeat buyers.
Western affiliates chasing dollar payouts should stay in the US, UK and Germany. Volume plays belong to local creators who already own the language and the shipping window.
Europe Went From Test Market To Ten Countries
Europe was the quiet story of 2026. TikTok Shop went live in Austria, Belgium, the Netherlands and Poland on 15 June, taking the European count to ten.
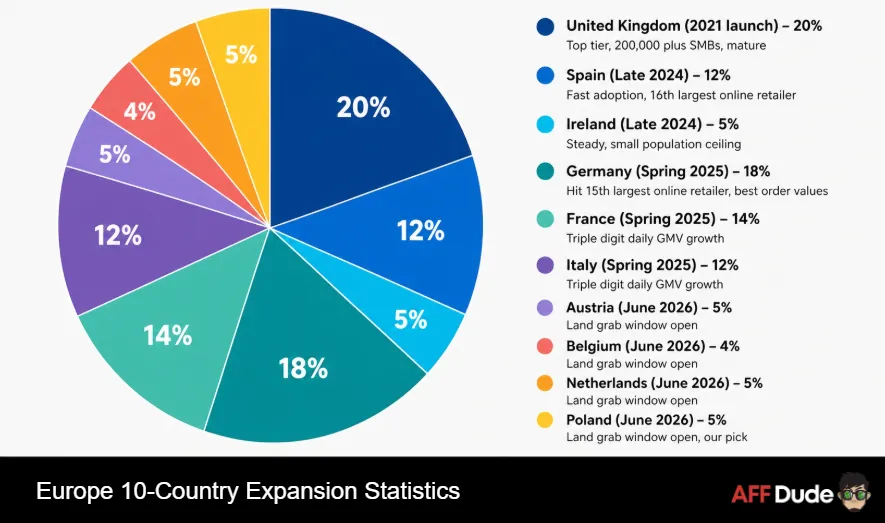
That sits alongside the UK, Germany, France, Italy, Spain and Ireland. More than 100,000 European businesses had already signed up before the latest four opened.
| Market | Launched | Seller Base | Maturity Signal | Affiliate Opportunity |
|---|---|---|---|---|
| United Kingdom | 2021 | 200,000 plus SMBs | Top tier beauty retail destination within 18 months | High. English content, mature creator pool |
| Spain | Late 2024 | Part of the 100,000 EU base | 16th largest online retailer inside 18 months | High. Low competition, fast adoption |
| Germany | Spring 2025 | Part of the 100,000 EU base | Hit 15th largest online retailer even faster | High. Best order values in the EU |
| France and Italy | Spring 2025 | Part of the 100,000 EU base | Triple digit daily GMV growth reported | Medium to high. Localisation needed |
| Ireland | Late 2024 | Smaller base | Steady, small population ceiling | Medium. Good testbed for UK creatives |
| Austria, Belgium, Netherlands, Poland | June 2026 | Registration opened June | Too early to judge | Very high. Land grab window is open now |
TikTok also shipped a feature called Sell Across Europe. One registration now covers multiple EU markets with localised listings and partnered logistics.
That single change is bigger than the four new flags. It cuts the setup tax on cross border TikTok sellers from months to days.
One catch. The EU scrapped the 150 euro customs exemption in 2026 and made marketplaces liable for product compliance.
Cheap cross border listings just got more expensive to run. Anyone building an EU play on sub 20 euro imports should redo the maths.
What we would bet on: we expect the four new EU markets to add $2 billion to $3 billion in combined GMV by end of 2027. Poland is our pick of the four.
Where The Money Actually Comes From: Video, Live Or Shop Tab
TikTok Shop sells through three surfaces. Short videos with tagged products, live streams, and the standing Shop tab.
The mix shifted noticeably in 2025, and the direction of travel tells you where to point your effort.
Video losing share does not mean video is dying. Total GMV grew 68%, so video revenue still went up sharply in absolute terms.
What changed is that the other two surfaces grew faster. Buyers are starting to treat TikTok like a shop rather than a feed accident.
Short form video commerce remains the entry point for most creators. Live is where the top earners live.
Nine of the ten highest grossing US creators on the platform in 2025 made their money primarily through live selling. Not one of them got there posting once a week.
Category Breakdown: What Sells And What Just Looks Busy
TikTok Shop skews hard toward products you can demonstrate on camera in fifteen seconds.
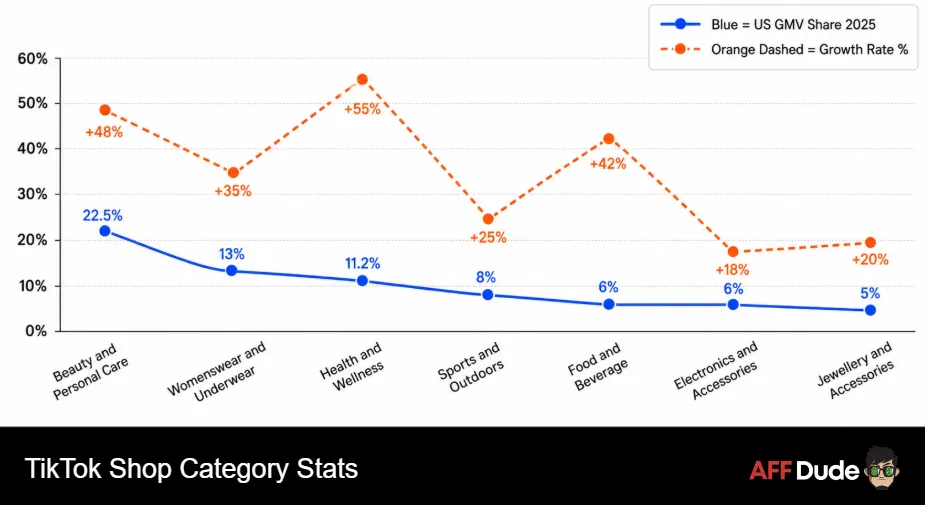
Beauty leads everywhere. It is the largest category in the US, in Indonesia and across nearly every market the platform operates in.
| Category | US GMV Share 2025 | Growth Rate | Typical Price Point | Return Rate Risk | Affiliate Verdict |
|---|---|---|---|---|---|
| Beauty and personal care | 22.5% | Around +48% | $30 to $50 | Low to medium | Crowded but still the safest bet |
| Womenswear and underwear | Around 13% | Strong | $15 to $40 | High, sizing returns bite | Volume play, watch clawbacks |
| Health and wellness | 11.2% | Around +55% | $25 to $60 | Low | Fastest riser, best margin fit |
| Sports and outdoors | Around 8% | Solid | $20 to $70 | Medium | Underrated, less creator competition |
| Food and beverage | Around 6% | Around +42% | $10 to $30 | Very low, 2% to 4% | Low ticket, high repeat, quietly profitable |
| Electronics and accessories | Around 6% | Moderate | $25 to $120 | High | Thin commissions, avoid unless you own the niche |
| Jewellery and accessories | Around 5% | Prices up 36% | $20 to $90 | Medium | Only category where pricing power improved |
Two numbers in that table deserve a second look.
First, beauty and personal care is the biggest but not the fastest. Health and wellness grew faster in 2025 and could take second place outright by 2027.
Second, jewellery was the only major category where average prices rose, up 36% on the year. Fifteen of twenty seven categories saw prices fall.
Functional foods deserve a mention on their own. Collagen, hair growth supplements and beauty adjacent food products grew 265% year on year.
That is the fastest moving sub category we have seen on any platform since push traffic was cheap in 2017.
Dude's margin maths: beauty gets the headlines, food and wellness get the margin. A 3% return rate beats a 4% higher commission every single time once you run the numbers over ninety days.
The Seller Reality Check: 803,500 Stores, Half Sold Nothing
This is the section most TikTok Shop Statistics roundups skip, because it ruins the fairy tale.
The US had 803,500 stores on the platform in 2025. More than half recorded zero sales for the entire year.
Just over 2,000 stores cleared $1 million in GMV. That is roughly one in every four hundred.
We built those middle tiers from the reported endpoints and our own network data, so treat the middle rows as our reading rather than platform disclosure.
The shape is not in doubt though. Concentration on TikTok Shop is severe, and it got worse as store count doubled.
Our position on this has not changed since 2024. Store count is a vanity metric. Active seller count is the one worth watching.
Roughly 475,000 US shops exist on paper, and around 216,000 of them actually move product. Everything else is dormant registration.
TikTok Shop Seller Fees In 2026: The Real Take Rate
The headline fee is 6%. The real cost of selling is nowhere near 6%.
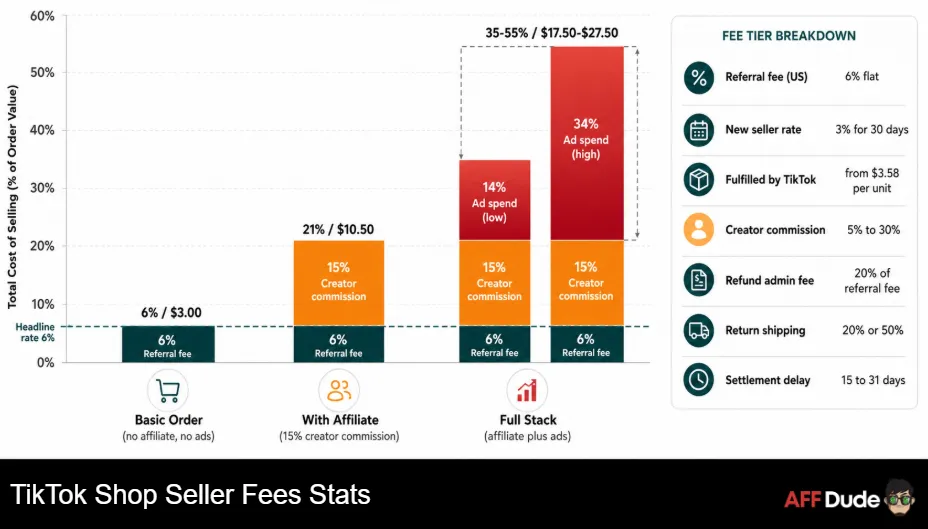
TikTok Shop seller fees stack in layers, and the layers are where margin disappears.
| Cost Line | 2026 Rate | Applies To | Notes |
|---|---|---|---|
| Referral fee (US) | 6% flat | Every order | Select jewellery sits at 5%. Covers payment processing too |
| New seller rate | 3% for 30 days | First order within 60 days of onboarding | Activates within 48 hours of first sale |
| Fulfilled by TikTok | From $3.58 per unit | Sellers using platform logistics | Independent shipping ended in March 2026 |
| Creator commission | 5% to 30% | Affiliate driven orders | Beauty 15% to 30%, tech 5% to 10% |
| Refund admin fee | 20% of the referral fee | Refunded orders | Capped, but it stacks on high return categories |
| Return shipping | 20% or 50% | All returns | 20% if Shop Performance Score is 4 or above, else 50% |
| Settlement delay | 15 to 31 days | All payouts | Star Shops clear in 1 to 8 days, flagged accounts wait longest |
Run it end to end and the picture changes fast. A $50 order with no affiliate and no ads costs you $3.00 in platform fees.
Add a 15% creator commission and the same order costs $10.50, or 21% of the sale. Layer ads on top and total cost of selling lands somewhere between 35% and 55% of revenue.
The TikTok Shop referral fee is the least of your worries. Commission plus returns plus ad spend is what decides the outcome.
Real talk, dude: the mandatory move to Fulfilled by TikTok logistics in March 2026 killed a lot of dropship models overnight. If your edge was cheap self shipping, that edge is gone.
Creator Commissions: What TikTok Shop Affiliates Actually Earn
Now the bit our readers care about most. TikTok Shop runs the biggest native affiliate programme in social commerce, and it pays better than most people assume.
Sellers set the rate, not TikTok. The allowable band runs from 1% to 80%, though real world rates cluster far tighter.
The average US commission rate reached 13.02% in 2026, and it has been climbing rather than falling. Brands are competing for good creators.
| Creator Tier | Follower Range | Typical Monthly Earnings | Usual Commission Band | Main Revenue Driver | Our Read On It |
|---|---|---|---|---|---|
| Nano | 1,000 to 10,000 | $200 to $1,500 | 10% to 15% open collaboration | One or two videos that catch | Realistic starting point, needs volume |
| Micro | 10,000 to 100,000 | $500 to $5,000 | 12% to 20% | Consistent posting plus seeded product | Best effort to reward ratio on the platform |
| Mid tier | 100,000 to 500,000 | $2,000 to $15,000 | 15% to 25% targeted | Brand partnerships and repeat products | Where affiliate income starts replacing a salary |
| Top tier | 500,000 plus | $15,000 and up | 25% to 50% negotiated | Live selling sessions | Live is non negotiable at this level |
| Top 1% | Varies | Around $600,000 annual GMV | Custom deals plus guarantees | Daily live plus a team | A business, not a side hustle |
Some context on those bands. TikTok Shop affiliate commission rates sit well above what Amazon Associates pays in most categories.
Beauty and supplements sit at the top end. Electronics sit at the bottom, usually 3% to 8%, because hardware margins are thin.
Around 54,000 creators now clear $10,000 or more in annual GMV through affiliate links. The number of US creators generating over $1 million in GMV tripled to 1,785 in 2025, up from 529.
Distribution is savage though. The top 0.5% of creators generate 38% of all affiliate revenue on the platform.
Performance Benchmarks Worth Writing Down
Notes from the trenches: commissions clawback on refunds 30 to 60 days after payout. Every affiliate in our Slack who treated month one earnings as profit got a nasty surprise in month three. Hold back 20% until settlement clears.
Conversion Rates: Why Marketers Keep Coming Back
Here is the number that keeps budget flowing into the channel despite everything above.
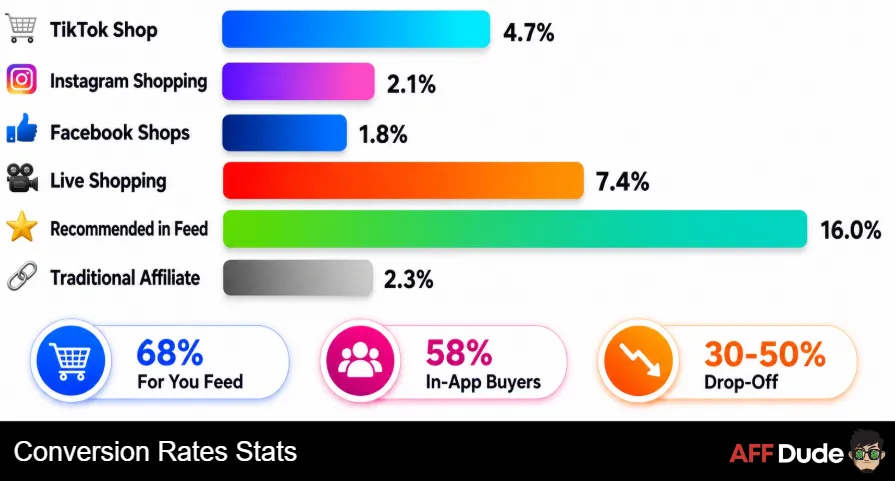
TikTok Shop converts at roughly 4.7%. Instagram Shopping sits at 2.1%. Facebook Shops sits at 1.8%.
The reason is short and unglamorous. Checkout never leaves the app.
Traditional affiliate links lose 30% to 50% of traffic to app switching, load times and abandoned carts. TikTok Shop deletes that leak entirely.
That is the whole edge. Not better creative, not better targeting, just fewer steps between wanting and paying.
Average Order Value: Small Baskets, Enormous Volume
TikTok Shop is a low ticket machine. Anyone modelling it on Amazon basket sizes will get the forecast badly wrong.
US transaction data puts the median order around $35, while consumer surveys report closer to $59. Bundled beauty and apparel orders reach $63 to $64.
Global average order value benchmarks vary wildly by market. Indonesia and Malaysia average roughly $5 an order. Singapore sits near $20.
Read those last two together and something jumps out. Heavy users spend real money. The average buyer barely spends anything.
Our view is that TikTok Shop is an acquisition channel wearing a marketplace costume. Treat it as paid acquisition and the economics make sense. Treat it as a retention engine and you will be disappointed.
Buyer Behaviour And The Loyalty Leak
Around 80.4 million US users are expected to shop through TikTok during 2026, roughly 67% of the platform's US audience.
More than half of all US social buyers, about 51%, will make a purchase on TikTok this year. That makes it the dominant channel inside social commerce.
Now the uncomfortable stat. Roughly 30% of TikTok Shop buyers later repurchase the same product on Temu, often cheaper.
That is a loyalty leak, and it is structural rather than fixable with better email flows.
Straight from the Slack: multiple members told us their TikTok Shop buyers rarely return without another video. No video, no repeat order. Budget for continuous content, not a launch campaign.
Return Rates And The Margin Trap Nobody Mentions
Returns are the fastest way to turn a good looking campaign into a loss.
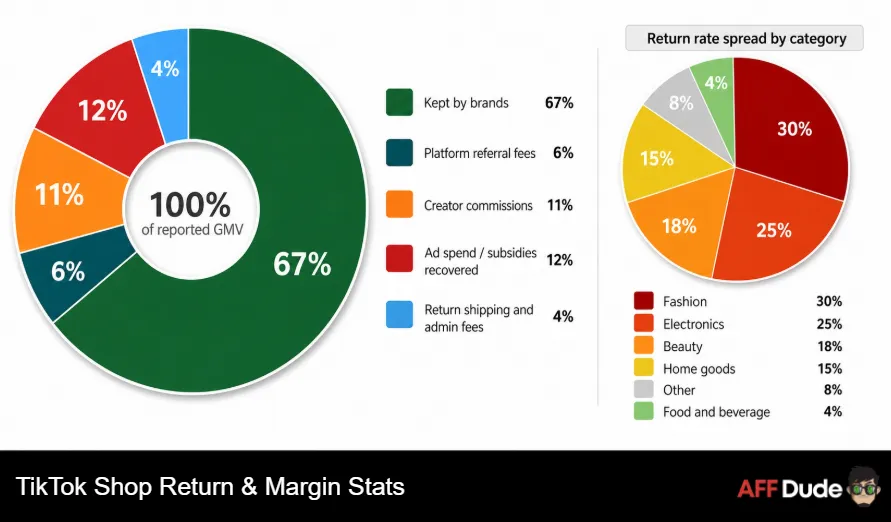
Product return rate data across the platform varies enormously by category, and the spread decides your real margin.
Stack it all up and a 15% commission programme costs a brand closer to 26.6% once subsidies, shipping fees and non refundable commissions are counted.
Brands keep roughly 67% of their reported GMV after platform fees, commissions and returns. That is the number to model, not the headline.
The Ownership Change That Barely Moved The Numbers
On 22 January 2026, TikTok's US operations moved into a new entity called TikTok USDS Joint Venture LLC.
American investors including Oracle, Silver Lake and MGX took majority ownership. ByteDance kept a minority stake of roughly 19.9%.
Sellers braced for chaos. Almost nothing happened operationally.
Our read is that the ownership question is settled enough for planning purposes. The regulatory risk that scared advertisers in 2024 and 2025 is now priced in.
For anyone who paused TikTok Shop spend waiting for clarity, the clarity arrived. What did not arrive is cheap traffic.
TikTok Shop Versus The Old Affiliate Playbook
We rank 380 plus networks on AffDude, so this comparison comes up in our inbox weekly.
Amazon Associates generated roughly $14 billion in affiliate revenue globally last year. TikTok Shop's US only affiliate volume is closing in on that on its own.
That last point is the trade. Affiliate marketing on TikTok Shop pays more per sale but demands constant output.
About 34% of creators who were Instagram exclusive in 2024 now run TikTok Shop campaigns alongside. For beauty and fashion creators that figure reaches 52%.
Our advice to the 94,000 people in our community has been consistent. Keep the evergreen SEO asset, add TikTok Shop as the velocity layer, do not swap one for the other.
What We Expect From TikTok Shop Through The Rest Of 2026
Time to put our own numbers on the table. These are AffDude calls, built from the data above plus what our members report month to month.
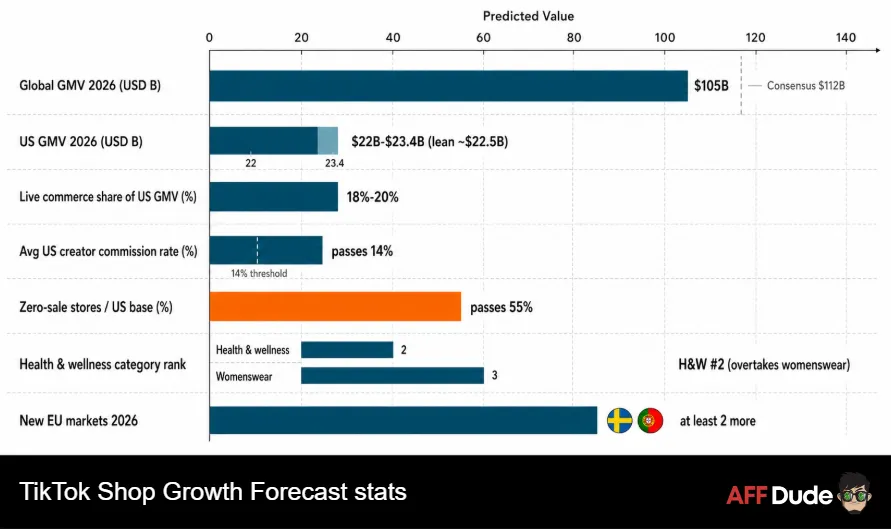
We will revisit each of these when the 2027 numbers land and mark our own homework publicly. That is how we have handled every AffDude data study.
The Dude's final read: the easy money on TikTok Shop ended in 2025. What is left is a properly big, properly competitive channel that rewards operators with content systems and punishes tourists. Same as every channel eventually.
How To Use These TikTok Shop Statistics In Your Own Planning
Numbers without a decision attached are just trivia. Here is how we would apply the set above.
Final Word From The Dude
We wrote this set of TikTok Shop Statistics because the existing ones read like press releases with a chart bolted on.
The channel is real. Sixty four billion dollars is not a fad, and a 4.7% conversion rate is not a rounding error.
But half a million American stores sold nothing last year, and that number belongs in the same paragraph as the growth chart. Both things are true.
If you are going in, go in with a content system, a margin model and a clawback buffer. If you are going in because a guru posted a screenshot, do something else.
The Dude abides. Go make some money.
Sources And Further Reading
- Momentum Works and Tabcut, TikTok Shop in the US 2025
- eMarketer, TikTok Shop Sales Growth 2026
- eMarketer, US Social Commerce Forecast 2026
- eMarketer, Social Commerce FAQ 2026
- TikTok Newsroom, TikTok Shop Expands Across Europe
- eMarketer, TikTok Shop Europe Expansion
- Statista, TikTok Shop Topic Hub
- DataReportal, Global Social Media Statistics
- NielsenIQ, Consumer and Retail Insights
- Retail Dive, TikTok Shop Drives Social Commerce Growth
- Influencer Marketing Hub, TikTok Statistics
- Social Media Today, TikTok Shop EU Merchant Countries
- Ecommerce News Europe, TikTok Shop Pan European Marketplace
- DealStreetAsia, TikTok Shop GMV 2025
Recommended Articles