Proxy Market Statistics 2026: $4.2B Market Is Surging Fast
 23 min read
The global proxy service market sits near $4.2 billion in 2026, heading for roughly $8.7 billion by 2030. Residential IPs pull about 42% of that revenue. Bots now push past half of all web traffic.
Residential bandwidth runs $1 to $15 per GB, and the honest mid-market rate lands near $3 to $8. We buy this stuff every month for ad checks, SERP tracking and offer scouting. Here are the Proxy Market Statistics that actually change what you pay.

The Dude's read: Proxies stopped being a sneaky side tool. They became plumbing. Price per GB matters less than cost per successful request, and 2026 is the year that gap got brutal.
Proxy Market Statistics 2026 At a Glance
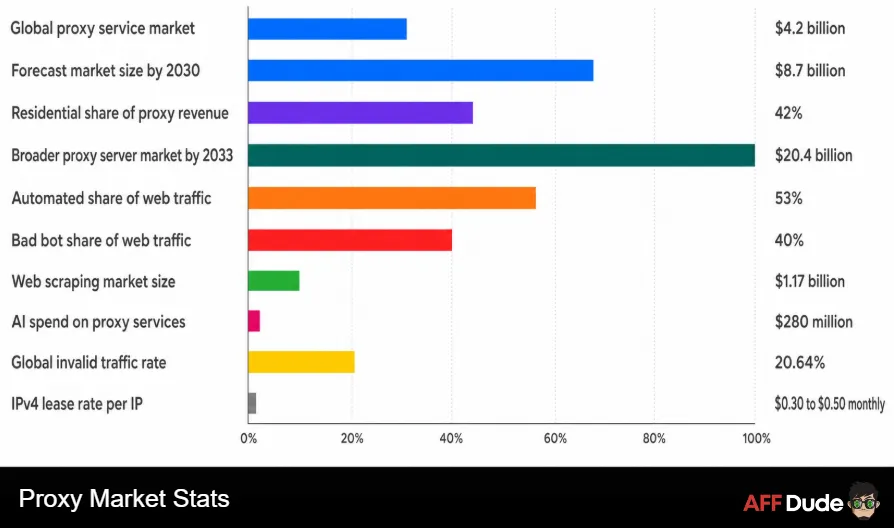
Short on time? Park here. These are the numbers we keep pulling up when we plan a scrape, price a campaign, or argue with a vendor about their “unlimited” plan.
| Metric | 2026 Figure | Why It Matters to You |
|---|---|---|
| Global proxy service market | About $4.2 billion | Bigger than most affiliate networks combined |
| Forecast market size by 2030 | About $8.7 billion | Roughly double in four years |
| Residential share of proxy revenue | About 42% | Up from 35% in 2023 |
| Broader proxy server market by 2033 | About $20.4 billion | 14.8% yearly growth from a $5.9 billion base |
| Automated share of web traffic | About 53% | Machines outnumber humans online |
| Bad bot share of web traffic | About 40% | Seventh straight year of growth |
| Mid-market residential price | $3 to $8 per GB | Enterprise volume drops under $1 |
| Largest claimed residential pool | 400 million plus IPs | Pool size is marketing, freshness is reality |
| Web scraping market size | About $1.17 billion | The demand engine sitting under proxies |
| AI spend on proxy services | About $280 million | A use case that barely existed in 2023 |
| Global invalid traffic rate | About 20.64% | One in five impressions is junk |
| IPv4 lease rate per IP | $0.30 to $0.50 monthly | The raw cost floor under every plan |
One pattern jumps out fast. Supply got cheaper. Demand got hungrier. And the gap between a clean pool and a burned one turned into real money.
How Big the Proxy Money Actually Got This Year
The proxy service market landed near $4.2 billion in 2026. Forecasts put it around $8.7 billion by 2030.
Now, you will see wildly different numbers floating about. Some reports quote $1.9 billion. Others shout $20 billion. Both can be right.
Why the mess? They count different things. A narrow report counts pure proxy subscriptions only.
A wide one folds in scraping APIs, unblockers, datasets and managed collection. That second bucket is where most enterprise spend actually goes now.
Our number for planning purposes is $4.2 billion. We think real spend edges a bit higher than that.
Reason being, huge chunks of proxy budget hide inside scraping API invoices. Nobody labels it “proxy” on the line item
AffDude reality check: Ignore any headline promising $200 billion by 2035. Fun for LinkedIn. Useless for your media buying budget. Look at this year and next.
Which Proxy Type Eats the Biggest Slice
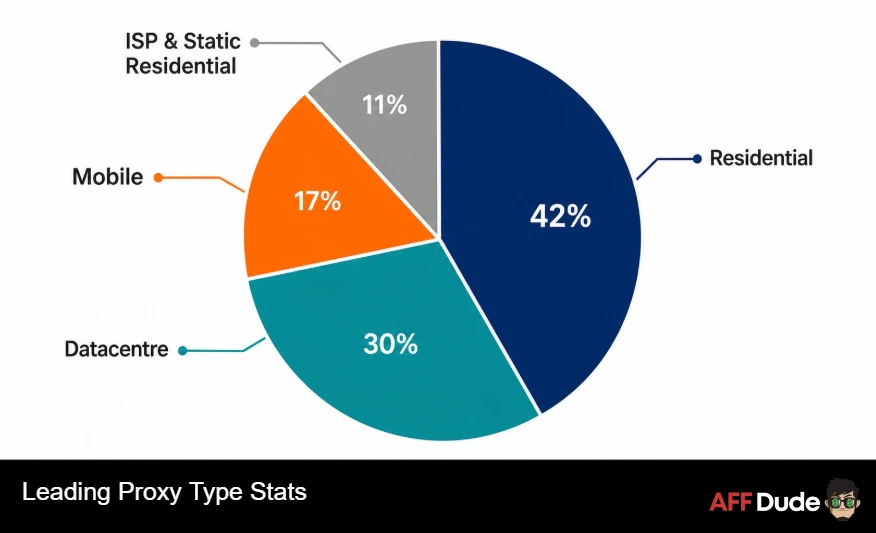
Four types split the market. Each solves a different problem, and each carries a very different price tag.
| Proxy Type | Revenue Share 2026 | Typical Price | Success Rate on Protected Sites | Best Use Case |
|---|---|---|---|---|
| Residential | About 42% | $1 to $15 per GB | 92% to 98% | Ad checks, offer scouting, protected targets |
| Datacentre | About 30% | From $0.50 per GB | 65% to 80% | Bulk crawling on soft targets |
| Mobile (4G and 5G) | About 17% | $2 to $12 per GB | Highest trust scores | App testing, social accounts, mobile ad checks |
| ISP and static residential | About 11% | Per IP monthly pricing | High and stable | Long sessions, logged-in accounts, rank tracking |
Residential kept the crown for a boring reason. Anti-bot systems trust home connections more than server farms.
Datacentre is not dead though. Far from it.
For unprotected targets, it stays the cheapest way to move volume. We still run datacentre for basic price checks and switch only when blocks show up.
Mobile is the sleeper. Carrier-grade NAT means thousands of real users share one mobile IP, so blocking that IP hurts real customers. Sites hate doing that.
A quick Dude tip: Start every job on datacentre. Move to residential only after you confirm the blocks are IP-based, not a broken selector in your parser. We have watched teams burn $400 of premium bandwidth on a typo.
Bots Took Over the Web and Nobody Held a Vote
Here is the stat that reframes everything else on this page. Automated traffic passed 53% of all web requests in 2026 reporting, up from 51% the year before.
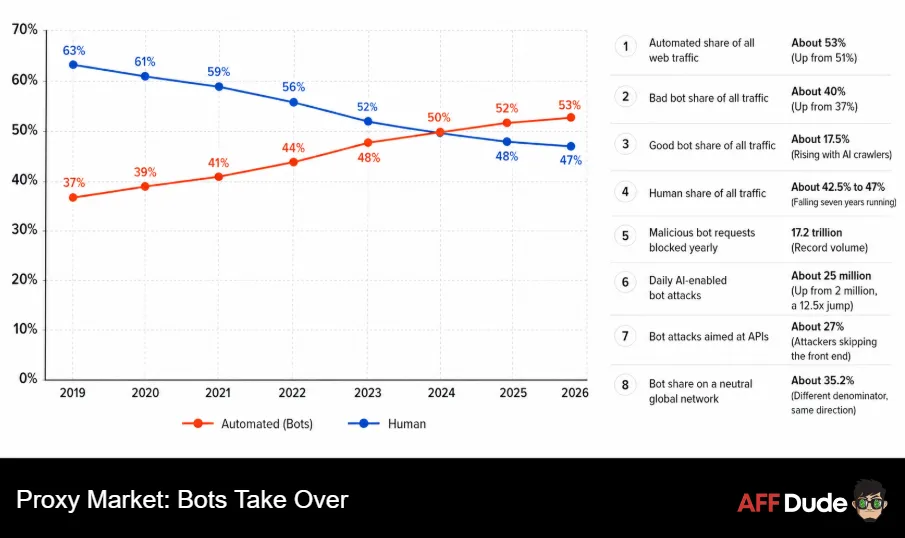
Human traffic dropped to about 47%. And it keeps falling.
Bad bots alone account for roughly 40% of traffic. Good bots, meaning search crawlers and monitoring tools, add another 17.5%.
Do the maths. Less than half of what hits your landing page is a person.
| Bot Traffic Metric | 2026 Figure | Change on Last Year |
|---|---|---|
| Automated share of all web traffic | About 53% | Up from 51% |
| Bad bot share of all traffic | About 40% | Up from 37% |
| Good bot share of all traffic | About 17.5% | Rising with AI crawlers |
| Human share of all traffic | About 42.5% to 47% | Falling seven years running |
| Malicious bot requests blocked yearly | 17.2 trillion | Record volume |
| Daily AI-enabled bot attacks | About 25 million | Up from 2 million, a 12.5 times jump |
| Bot attacks aimed at APIs | About 27% | Attackers skipping the front end |
| Bot share on a neutral global network | About 35.2% | Different denominator, same direction |
That last row deserves a note, because people fight about it online constantly.
Security vendors measure the attack surface they defend. Neutral network measurement counts everything, including plain traffic nobody bothers attacking.
Both readings are honest. They just answer different questions.
Why does any of this belong in a proxy report? Because every one of those automated requests needs an exit IP. That demand is the whole business.
Straight talk from Ali: When bots pass half the web, your analytics lie by default. Filter invalid traffic before you judge a campaign, or you will scale a losing offer with total confidence.
What Proxy Bandwidth Really Costs in 2026
Pricing moved a lot this year, and mostly downward. Two years ago, $8 per GB was normal. Now that looks steep.
Here is the honest ladder we see when we shop plans.
| Tier | Residential Price per GB | Typical Commitment | Who Buys It | Watch Out For |
|---|---|---|---|---|
| Pay as you go entry | $8 to $15 | None | Testers, one-off audits | Traffic that expires monthly |
| Budget self-serve | $1 to $3 | Small top-ups | Solo affiliates, small scrapers | Smaller pools, more retries |
| Mid-market standard | $3 to $8 | Monthly plan | Agencies, growth teams | Overage fees on spikes |
| Volume tier | $1.75 to $4 | 500 GB plus | Serious data teams | Unused bandwidth wasted |
| Enterprise contract | $0.50 to $2.50 | 1 TB plus, yearly | Retail, fintech, AI labs | Long lock-in periods |
| Datacentre any volume | $0.50 to $3 | Flexible | Everyone, as step one | Blocked on defended sites |
| Mobile 4G and 5G | $2 to $12 | Monthly or per GB | Social, app and mobile ad work | Slower speeds, higher jitter |
Premium providers still list high. One major name shows around $15 per GB at list price, then drops near $3.30 per GB at 10 TB volume.
Budget providers now advertise $1 per GB with no monthly minimum. A few push under that.
So has bandwidth become cheap? Sort of. Sticker price fell hard. Effective price fell far less.
The Number Nobody Advertises
Cost per successful request is the only metric worth tracking. Sticker price is a vanity number.
Run the maths yourself. A pool at $1.50 per GB with a 60% success rate delivers usable data at about $2.50 per GB.
A cleaner pool at $1.90 per GB with near-perfect success delivers at $1.90. The “cheap” option costs roughly 32% more.
We learned this the annoying way. Our first bulk buy in a cheap pool looked like a steal, then chewed 3.4 times the projected bandwidth on retries.
Our house buying rule: Run 500 requests through any provider against your real target URLs before you sign anything. Not their demo site. Yours.
Who Owns the Biggest IP Pools Right Now
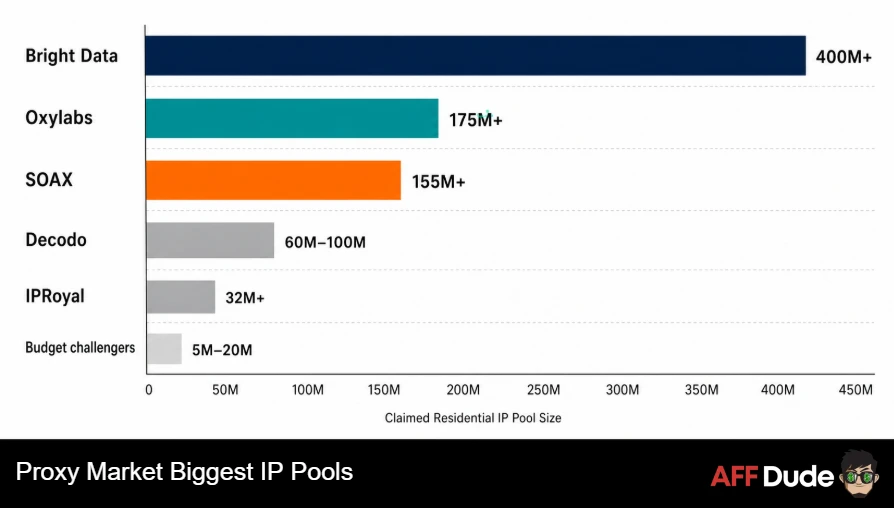
Pool size is the most-quoted and least-useful stat in the whole sector. Still, you should know the numbers.
| Provider | Claimed Residential Pool | Entry Price per GB | Volume Price per GB | Known For |
|---|---|---|---|---|
| Bright Data | 400 million plus | About $4 pay as you go | From $2.50 | Largest catalogue, heavy compliance checks |
| Oxylabs | 175 million plus | About $6 to $12 | From $2.50 | Enterprise SLAs, fast response times |
| SOAX | 155 million plus | About $90 entry plan | Volume tiers | Granular city and carrier targeting |
| Decodo | 65 million to 115 million | About $2.20 to $4 | Lower on commitment | Speed and value balance |
| IPRoyal | 32 million plus | About $7 | About $1.75 at 500 GB | No-fuss pay as you go |
Notice something odd. Claimed pools grew far faster than the market did.
That should raise an eyebrow. Pools overlap heavily, because operators resell each other's capacity behind the scenes.
Independent research found the sector's fragmentation is largely an illusion. Many “separate” brands draw from shared infrastructure.
Our take on pool numbers? Treat any figure above 100 million as a marketing claim, not a technical spec. What matters is how many of those IPs are fresh, unbanned and actually available in your target country tonight.
A blunt Dude warning: Multi-vendor redundancy is fake if both vendors resell the same upstream. Ask directly whose network you are buying. Watch how fast they change the subject.
AI Crawlers Became the Loudest Buyer in the Room
This is the biggest shift since we started tracking proxy spend. AI training and answer engines now drive a serious slice of demand.
AI-related bots hit about 33.8% of all bot traffic by mid-2026. Break that down and you get AI crawlers near 17.7%, AI assistants near 9%, and AI search near 7%.
Traditional search engine crawlers? About 26.8%. AI officially passed search as the largest category of automated traffic.
AI companies now spend roughly $280 million yearly on proxy services purely for training data collection. Three years ago that budget line did not exist.
The Crawl-to-Referral Gap Publishers Hate
Here is where publishers and affiliates should pay close attention. Some AI crawlers take enormous amounts of content and send back almost nothing.
The measure people use is simple. Count pages crawled, then count visitors sent back.
Roughly half of all AI crawling exists purely for model training. Training crawlers return close to zero visitors.
Those ratios swing month to month, sometimes wildly. One crawler jumped from under 10% to nearly 20% of AI bot traffic inside a single month during 2026.
So treat any single monthly ranking as a snapshot. The direction of travel is what counts.
Site owners fought back hard. More than 2.5 million sites now block AI training outright.
One infrastructure provider blocked 416 billion AI scraping requests across a five-month stretch. Retail sites absorb about 28.1% of all AI crawling, more than double any other sector.
Our honest read: Blocking every AI bot feels satisfying and costs you citations. We allow crawlers that send traffic back and block the pure takers. Check ratios, not vibes.
Web Scraping Is the Engine Under All of This
Proxies do not sell themselves. Scraping demand sells them.
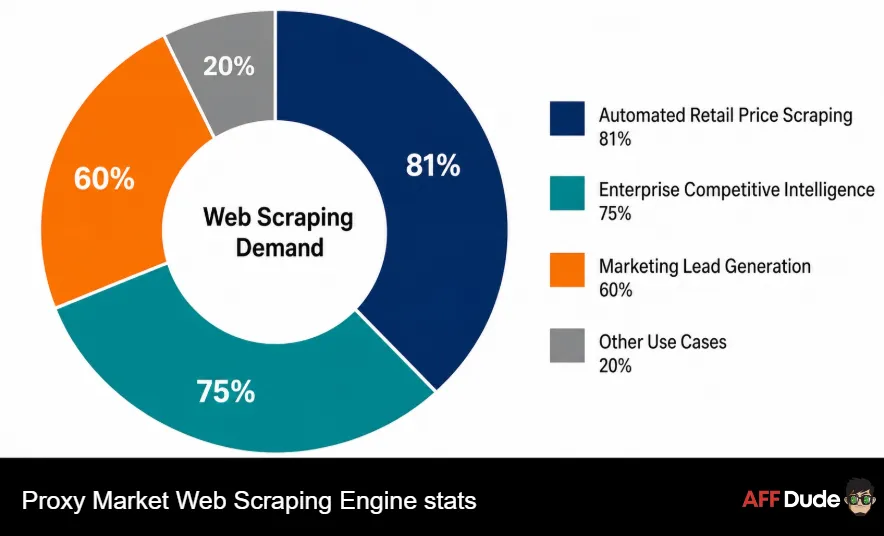
The web scraping market sits near $1.17 billion in 2026, up from about $0.99 billion in 2025. Forecasts put it around $2.23 billion by 2031.
Scraping software specifically sits near $875 million this year, heading toward $2.7 billion by 2035.
What changed? Retail pricing wars went fully automated.
API shutdowns pushed this further. Platforms locked down free data access, so teams rebuilt collection through browsers instead.
Every one of those requests needs an exit IP. That is the whole loop.
Ad Verification and Why Affiliates Burn Real Bandwidth
Now the part that hits our readers directly. If you run paid traffic, proxies are not optional any more.
Ad fraud losses passed $100 billion globally in 2026. That is up from around $84 billion in 2025.
Invalid traffic runs near 20.64% worldwide, measured across more than 105 billion impressions. Roughly $37 billion of US ad spend sits at risk yearly.
| Fraud Metric 2026 | Figure | Affiliate Impact |
|---|---|---|
| Global ad fraud losses | Over $100 billion | Inflated CPAs across every vertical |
| Global invalid traffic rate | About 20.64% | One in five impressions wasted |
| Direct affiliate fraud losses | About $3.4 billion | Commissions paid on fake conversions |
| Bot share of affiliate traffic | About 24% | Skewed EPC and conversion data |
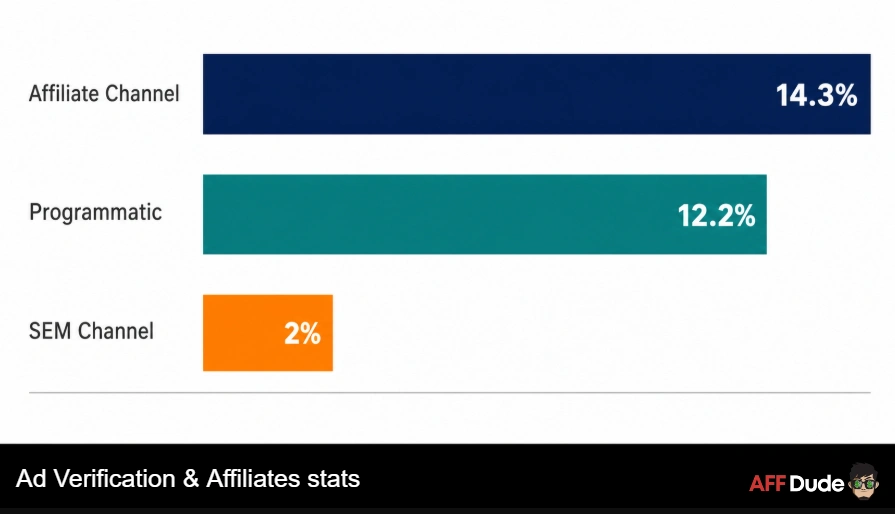
| Deceptive ad rate, affiliate channel | About 14.3% | Highest of any channel measured |
| Deceptive ad rate, programmatic | About 12.2% | Second worst offender |
| Deceptive ad rate, SEM channel | About 2% | Cleanest major channel |
| Fraud reduction with verification tools | About 55% | Verification pays for itself fast |
Here is why proxies matter for that list. Cloakers detect verification IPs and serve a clean page to them.
Check your own funnel from an office IP and everything looks perfect. Check from a residential IP in the actual target city and you might find a very different page.
We caught a partner running geo-swapped offers exactly this way. Clean creative for our datacentre check. Junk redirect for real users in Brazil.
What we do: Every offer we promote gets checked from three residential IPs in the top three converting GEOs. Costs us about 2 GB monthly. Has saved us far more than that in refunded spend.
Regulators and Google Came Knocking Hard
2026 was the year the messy end of this sector got a very public kicking.
In January 2026, Google disrupted the IPIDEA residential proxy network. The scale was genuinely wild.
Read that list again. Thirteen brands, one operator, and most buyers had no idea.
Then June 2026 brought a second strike, this time against NetNut. In a single week, 316 distinct threat clusters were spotted using its exit nodes.
What did investigators learn between the two actions? Something every buyer should note.
When one operator's network degrades, they simply buy capacity from rivals. They become a reseller overnight.
So the pool you rent today might belong to a network that got taken down last quarter. Sourcing questions stopped being a compliance nicety.
A word from Ali: If a provider cannot explain where its IPs come from in one clear paragraph, walk. Your campaigns should not sit on someone's hijacked TV box.
IPv4 Prices Quietly Set the Floor Under Everything
Most marketers never think about address economics. They should, because it sets the cost base for every datacentre and ISP proxy you buy.
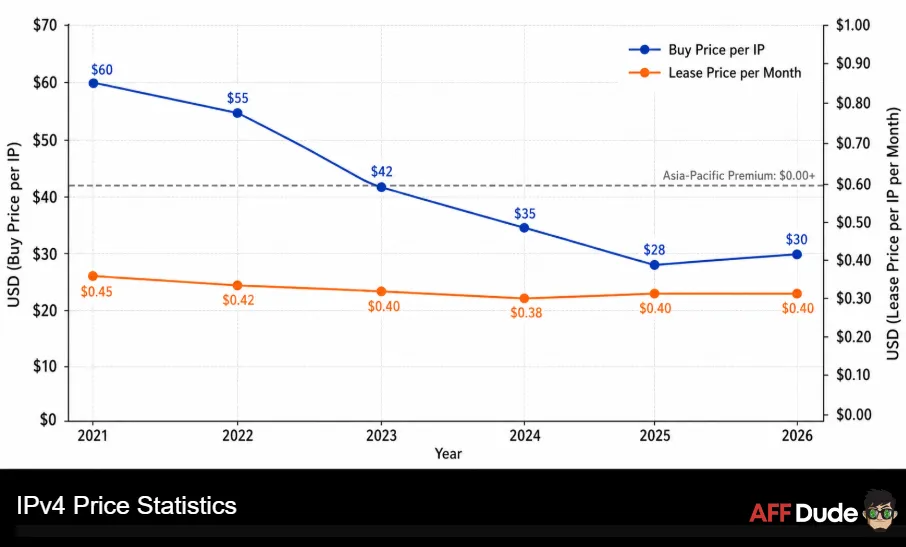
Buying an IPv4 address costs $18 to $45 in 2026. The market peaked above $60 back in 2021.
Leasing runs $0.30 to $0.50 per IP monthly on most platforms. That has barely moved in two years.
Two forces pull against each other here. Large blocks corrected downward hard. Small blocks held their value.
Small blocks matter more for proxies, because geo-diversity beats raw quantity. A provider needs addresses in 190 countries, not 65,000 in one datacentre.
Our call? Datacentre proxy prices have almost no room left to fall. The underlying address cost is the floor, and we are close to it.
Where Proxy Demand Actually Comes From
Time to map the demand side properly. Five workloads dominate commercial buying in 2026.
Social intelligence grew about 30% year on year. Brands want competitor monitoring and creator analytics at scale.
Alternative data quietly became one of the highest-paying use cases. Hedge funds care about accuracy far more than cost.
For our readers, the mix looks different. Affiliates lean heavily on ad verification, SERP tracking and offer scouting.
The Market Is Weirdly Fragmented, and That Is Changing
Here is a stat we find genuinely surprising. The top 10 proxy providers control less than 25% of total revenue.
Compare that with affiliate networks, where a single player holds nearly half the market. Proxies are a scrappy, crowded sector.
Private equity noticed. Over $500 million has flowed into proxy and data collection firms.
Consolidation is coming. We would bet on it heavily over the next two years.
The Dude predicts: Expect three to five serious acquisitions before the end of 2027. The middle tier gets bought or squeezed out. Budget players survive on price alone.
Success Rates Beat Price Every Single Time
We keep hammering this because vendors keep hiding it. Success rate decides your real cost.
Residential pools hit 92% to 98% against protected targets. Datacentre manages 65% to 80% on the same sites.
The fastest tested provider clocked around 0.54 second response times with a success rate near 99.7%. Slower enterprise scraping APIs measured over 17 seconds on some tests.
Speed matters more than people expect. At scale, a 17-second average turns a one-hour job into a full day.
What Actually Kills Success Rates
- Bot detection now checks TLS fingerprints, not just IP reputation.
- Browser fingerprint mismatches flag you instantly.
- Timezone conflicts with IP geography trigger challenges.
- Reused IPs from abused pools arrive pre-blocked.
- Session length matters, since home connections rotate their own leases.
Machine learning models became the default on major protection services in 2026. A clean IP alone no longer gets you through.
That shift changed what you are buying. You are not renting an address any more. You are renting a plausible identity.
AffDude's Proxy Market Projections for 2027 and 2028
Right, this is the bit you will not find copy-pasted elsewhere. These are our own calls, built from buying this stuff monthly and watching prices move.
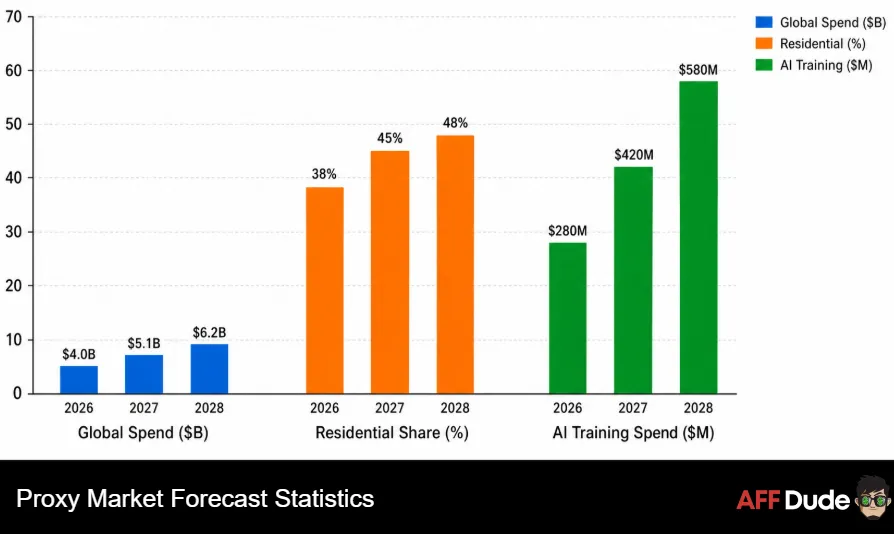
Could we be wrong on the edges? Sure. The pricing floor call is the one we hold loosest, because a supply shock changes everything.
But the direction feels locked. More automation. Cheaper bandwidth. Harder detection. Tighter rules.
Our long-range bet: By 2028, buying proxies looks like buying cloud compute. Metered, boring, contract-based, and nobody whispers about it any more.
How We Buy Proxies at AffDude
Fair question. We have been running traffic since 2013, and our buying process got simpler every year.
We stopped chasing the lowest advertised rate around 2022. Too many burned pools, too many retries.
- Define the target list first. Protection level decides proxy type, not budget.
- Test 500 real requests per candidate provider. Measure success rate, not speed alone.
- Calculate cost per successful request. Rank on that number only.
- Buy pay as you go for the first month. Never commit before you see real usage.
- Keep a second provider warm on a small plan. Redundancy saves campaigns.
- Re-benchmark every six months. Pools degrade, and prices keep falling.
That process costs a day of setup. It has saved us thousands, and it survives vendor rebrands.
FAQs About the Proxy Market in 2026
How big is the proxy market in 2026?
The global proxy service market sits near $4.2 billion in 2026, with forecasts pointing to about $8.7 billion by 2030. Broader measures that fold in scraping APIs and managed data collection put the figure closer to $6 billion.
What does a residential proxy cost per GB in 2026?
Residential bandwidth ranges from about $0.50 per GB at deep enterprise volume to $15 per GB for small pay as you go purchases. Mid-market rates land between $3 and $8 per GB.
Which proxy type has the biggest market share?
Residential proxies lead with roughly 42% of revenue in 2026, up from 35% in 2023. Datacentre follows near 30%, with mobile around 17% and ISP proxies making up the rest.
How much of web traffic is bots in 2026?
Automated traffic passed 53% of all web requests, with bad bots at about 40% and good bots near 17.5%. Neutral network measurements report a lower 35.2%, because they count a wider traffic base.
Are proxies legal to use for marketing?
Using proxies to collect publicly available information is generally lawful in the US, and courts have supported that position. Data protection rules in Europe still apply, so consent and data handling matter for anything involving personal data.
Why did Google shut down proxy networks in 2026?
Google disrupted IPIDEA in January 2026 and NetNut in June 2026 after finding hundreds of threat groups using their exit nodes. Both networks enrolled consumer devices through hidden software kits, often without meaningful user consent.
Do affiliates actually need proxies?
If you buy paid traffic, yes. Ad fraud passed $100 billion globally, invalid traffic runs above 20%, and cloakers serve clean pages to known verification IPs. Checking your funnel from real residential IPs is the only reliable audit.
What is the best metric for comparing proxy providers?
Cost per successful request beats price per gigabyte every time. A cheap pool with a 60% success rate can cost 30% more in practice than a slightly pricier pool that almost never fails.
The Bottom Line on the 2026 Proxy Market
Let us pull it together. The sector grew up fast.
A $4.2 billion market. Bots owning most of the traffic. Bandwidth cheaper than ever. Detection smarter than ever.
Here is the short version of what we would do starting fresh today.
The Proxy Market Statistics all point the same way. More machines, more data, tighter rules, thinner margins for lazy buyers.
That suits anyone willing to measure properly. It punishes anyone shopping on sticker price alone.
We have watched this sector grow from a grey-hat curiosity into serious infrastructure. The money is real. The scrutiny is real. And honestly? Both are good news for operators who run clean.
The Dude abides: Bookmark this page. We refresh our proxy data every year, and the pattern never wavers. Cheaper bandwidth, smarter walls, and fat rewards for whoever measures the right number.
Sources and further reading
- Imperva (Thales), 2026 Bad Bot Report
- Cloudflare Radar, Bot and Crawler Analytics
- Statista, Digital Ad Fraud and Proxy Market Data
- Mordor Intelligence, Web Scraping Market Report
- Knowledge Sourcing Intelligence, Residential Proxy Server Market
- Research Nester, Web Scraping Software Market
- Google Threat Intelligence Group, Residential Proxy Network Disruptions
- IPXO, IPv4 Price History and Lease Data
- Fraudlogix, State of Ad Fraud Report
- DoubleVerify, Global Insights on Fraud and Viewability
- Juniper Research, Digital Advertising Fraud Forecasts
- IAB, Invalid Traffic and Measurement Standards
Recommended Articles