

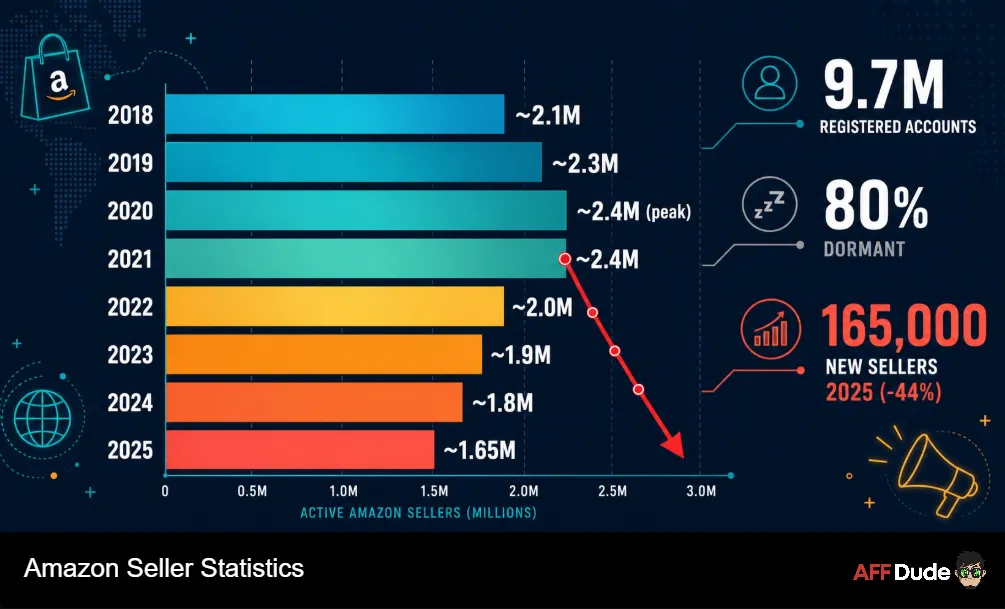
Amazon paid-unit share from third party sellers sits at 61% to 62%, and Amazon banked 172.2 billion in third party seller services revenue during 2025. Active sellers fell to roughly 1.65 million, down from 2.4 million in 2021. New sign-ups crashed to 165,000, a ten year low.
Yet more than 100,000 sellers now clear a million dollars a year. Fewer players, bigger pots. We have tracked these Amazon Seller Statistics since our first FBA campaign, and 2026 is the year the marketplace stopped rewarding tourists.
We have run offers, audited FBA P&Ls and watched sellers burn cash since 2013. Our read on 2026? Amazon got harder to enter and better to survive in. Traffic per seller keeps climbing. Lazy listings keep dying.

Amazon Seller Statistics 2026 at a Glance
Short on time? Park here. These are the numbers we keep pinned to the wall when we plan a launch or price a client audit.
| Metric | 2026 Position | Direction vs Prior Year |
|---|---|---|
| Amazon total net sales (2025 full year) | $716.9 billion | Up about 12% |
| Our full year call for 2026 net sales | $790 billion to $805 billion | Up 10% to 12% |
| Third party seller services revenue (2025) | $172.2 billion | Up 11% |
| Third party share of paid units | 61% to 62% | Flat at record highs |
| Third party share of total GMV | About 69% | Up from 60% in 2019 |
| Marketplace GMV (2025 full year) | $575 billion | Up 15% |
| First party retail GMV (2025 full year) | $255 billion | Down from $260 billion |
| Active sellers worldwide | About 1.65 million | Down from 2.4 million in 2021 |
| Registered seller accounts | About 9.7 million | Roughly 80% dormant |
| New seller registrations (2025) | 165,000 | Down 44% |
| Amazon advertising revenue (2025) | $68.6 billion | Up 22% |
| Global Prime members | About 240 million | Up modestly |
| Average FBA fee change for 2026 | Plus $0.08 per unit | Live from 15 January 2026 |
One thing leaps out of that table. Seller count shrank while seller revenue grew. Amazon is not running out of customers. It is running out of casual sellers.
The Great Squeeze: Why Seller Numbers Keep Falling
Here is the headline nobody wants to print. Amazon lost roughly 750,000 active sellers in four years.
Active accounts sat near 2.4 million in 2021. By the close of 2025, that figure landed around 1.65 million. Active means the account earned at least one customer feedback rating over twelve months.
So who left? Mostly arbitrage flippers and one-product hobbyists. Fee increases, ad inflation and stricter listing rules squeezed them out.
And the survivors? They got healthier. Traffic per active seller rose about 31% since 2021. Fewer shopfronts, same enormous crowd of buyers.
Dude reality check: A shrinking seller count is not bad news if you are already inside. Same buyers, fewer rivals in the search results. We would rather compete against 1.65 million serious operators than 2.4 million spray-and-pray listings.
New Seller Sign-Ups Just Hit a Ten Year Low
Amazon registered about 165,000 new sellers across 2025. Lowest annual intake in over a decade.
Compare with the 2020 peak near 295,000. Sign-ups dropped 44% year on year.
Why the collapse? Three reasons show up in every seller conversation we have.
Our honest view? Amazon does not mind. A smaller pool of committed sellers produces better listings and fewer refunds.
Where Amazon Sellers Actually Come From in 2026
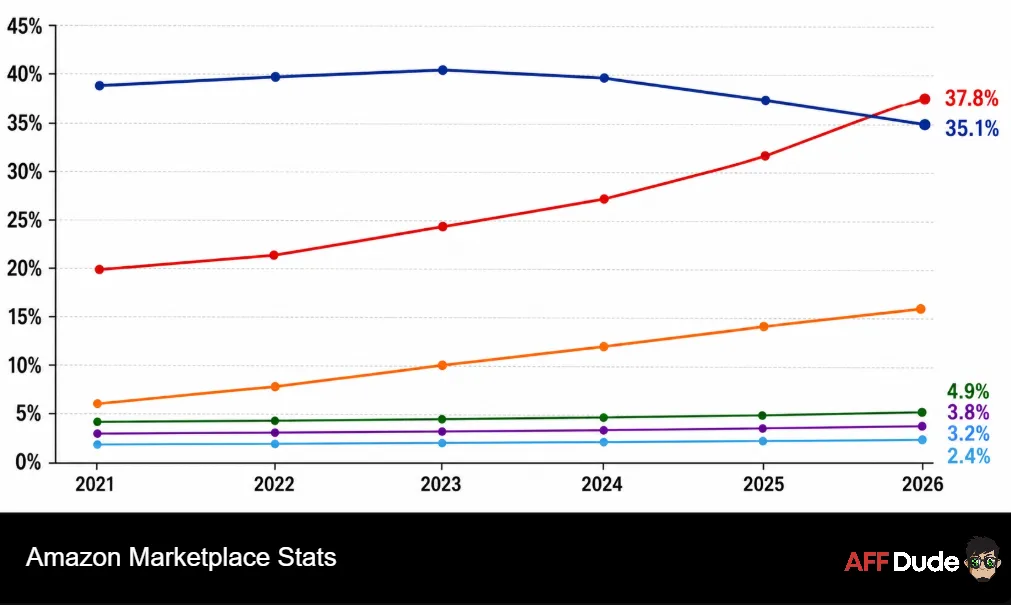
Seller geography shifted hard over five years. China-based sellers closed most of the gap on the United States.
Amazon now runs dedicated marketplaces across 21 countries. Product listings worldwide passed roughly 2.6 billion.
Chinese sellers hold close to half of third party revenue share inside some categories. Price wars in accessories got genuinely brutal because of that.
We watched an accessories client lose 40% of unit share in nine months. Nothing changed on his listing at all.
Three factory-direct rivals simply undercut him by $2. He could not match the price and stay solvent.
So we rebuilt around bundles instead. Same core product, packed with two accessories nobody else offered.
Unit share recovered inside a quarter. Margin actually finished higher than before the price war started.
What we would do: Stop trying to out-price factory-direct sellers. Beat them on bundles, brand story, photography and post-purchase service. Those are the levers a small operator can actually pull.
Amazon's Grip on US Ecommerce Keeps Tightening
Context matters here. Amazon is not just a big marketplace, it is most of the US online market.
Amazon held roughly 35.7% of the $1.2 trillion US ecommerce market during 2025. Some measures place its retail share above 40%.
Walmart, the nearest rival, sits below 10%. No other platform comes close on product breadth.
Prime membership props up that dominance. Around 240 million members globally, with close to 200 million in the United States alone.
Prime households buy more often and abandon carts less. That is why FBA listings convert better than merchant-fulfilled equivalents.
Conversion on Amazon runs several times higher than typical ecommerce sites. Purchase intent arrives pre-loaded.
Roughly four in five purchases flow through the featured offer placement. Losing the Buy Box effectively removes you from the shelf.
How Much Do Amazon Sellers Really Earn?
Time for a straight answer, because most articles dodge one. Amazon seller income is wildly uneven.
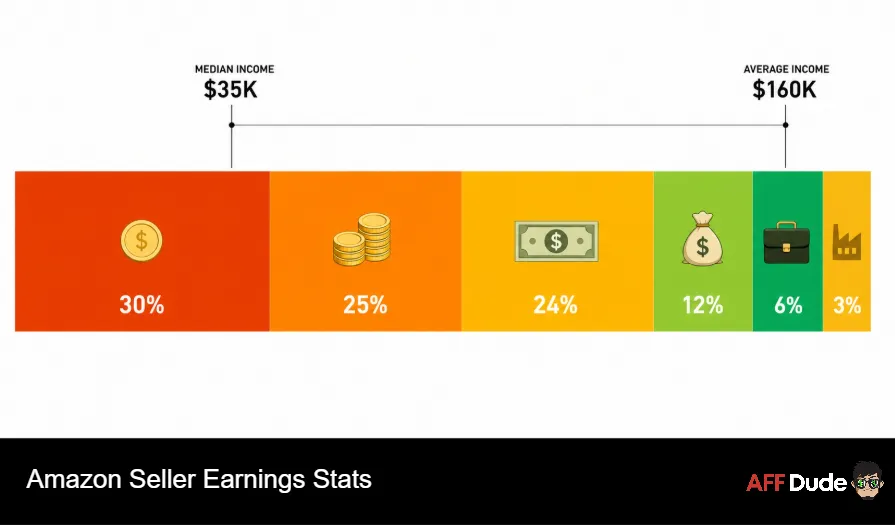
Average annual revenue for an FBA seller sits near $160,000. Median revenue lands closer to $35,000.
See the gap? A small group of monsters drags the average up. Most sellers earn far less than headlines suggest.
| Monthly Revenue Band | Share of Sellers | Typical Monthly Net Profit | Our Notes |
|---|---|---|---|
| Under $500 | About 30% | Under $100 | Mostly dormant or single-SKU testers |
| $500 to $2,000 | About 25% | $100 to $400 | Side-hustle tier, rarely scales without capital |
| $2,001 to $10,000 | About 24% | $400 to $2,100 | Where most part-time operators plateau |
| $10,001 to $25,000 | About 12% | $2,100 to $5,200 | Full-time income, needs real inventory planning |
| $25,001 to $100,000 | About 6% | $5,200 to $21,000 | Team territory, VA plus PPC manager |
| Above $100,000 | About 3% | $21,000 plus | Brand-level operators and aggregator targets |
SMB sellers average around $11,671 in monthly sales. At a 21% margin, take-home lands near $2,451 a month.
Roughly 58% of sellers reach profitability inside twelve months. About 22% get there in under three months.
Now the uncomfortable bit. Around 22% never turn a profit at all. Nobody puts that stat on a course sales page.
Profit Margins After Amazon Takes Its Slice
Margin is the only number that pays your rent. Revenue is vanity, dude.
About 57% of sellers report margins above 10%. Roughly 28% clear 20% or better.
Typical net margin across the marketplace sits between 15% and 20%. Well-run private label brands push higher.
Apparel and shoes carry the ugliest return rates, often 20% to 30%. Consumables and books sit far lower.
Margin rule we live by: If a SKU cannot survive a 5% fee rise and a 4 point ACoS jump, it was never profitable. It was lucky. Model the bad year before you order 2,000 units.
Amazon Fee Changes in 2026 and What They Cost You
Amazon went live with 2026 fee updates on 15 January. Referral percentages stayed put, which was the good news.
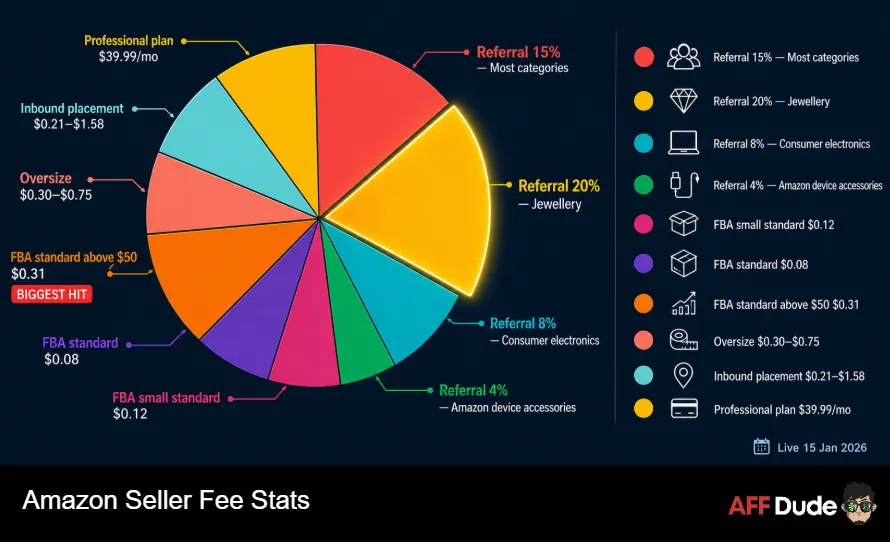
Fulfilment fees moved up by roughly $0.08 per unit on average. Under half a percent of a typical selling price.
Sounds tiny. Across 40,000 units a year, that is $3,200 gone.
| Fee Type | 2026 Rate or Change | Who Feels It Most | AffDude Comment |
|---|---|---|---|
| Referral fee, most categories | 15%, unchanged | Everyone | Only fee that stayed still, thankfully |
| Referral fee, consumer electronics | About 8% | Tech resellers | Thin margins survive only on volume |
| Referral fee, jewellery | Up to 20% | Accessory brands | Price above $100 or skip it |
| Referral fee, Amazon device accessories | About 4% | Cable and case sellers | Cheapest referral rate on the platform |
| FBA fulfilment, small standard | Up about $0.12 per unit | Low-ticket sellers | Hurts anything under $15 retail |
| FBA fulfilment, standard size | Up about $0.08 per unit | Most private label | Absorb or nudge price by $0.25 |
| FBA fulfilment, standard above $50 | Up about $0.31 per unit | Premium products | Biggest single hit of the year |
| Oversize tiers | Up $0.30 to $0.75 per unit | Furniture, fitness, bulky goods | Re-run your cubic maths before restocking |
| Inbound placement fee | $0.21 to $1.58 per unit | Single-location shippers | Split shipments to cut it |
| Fuel and logistics surcharge | Applied from 17 April 2026 | All FBA sellers | Quietly reprices your whole catalogue |
| Professional selling plan | $39.99 per month | Anyone above 40 units | Cheapest line on your entire P&L |
Amazon also tightened rules on aged inventory and low stock levels. Slow movers now cost real money.
Sellers with clean turnover under 90 days saw margin impact below 1%. Sellers sitting on dead stock got mauled.
FBA or FBM: How Sellers Split in 2026
Fulfilment choice drives your fee stack more than anything else. Here is the current split.
FBA still wins on Prime eligibility and Buy Box weighting. It also costs the most.
Hybrid is what we recommend to most brands now. Ship your fast movers through FBA, keep bulky slow movers on FBM.
Dude tip: Amazon retired several in-house prep options in March 2026. Line up a third party prep partner before your next container lands, not after.
Third Party Sellers Now Own the Marketplace
This is the structural story behind every other number here. Amazon stopped being a shop and became a mall.
Third party sellers accounted for 61% to 62% of paid units through 2025. That share is an all-time high.
By GMV, independent sellers now drive about 69% of the total. In 2019, that figure sat near 60%.
| Marketplace Measure | 2019 | 2023 | 2025 Full Year | Our 2026 Call |
|---|---|---|---|---|
| Third party share of paid units | 53% | 60% | 61% to 62% | 62% to 63% |
| Third party share of GMV | 60% | 66% | About 69% | About 70% |
| Marketplace GMV | $200 billion | $438 billion | $575 billion | $645 billion to $665 billion |
| First party retail GMV | $134 billion | $247 billion | $255 billion | $250 billion to $258 billion |
| Third party seller services revenue | $53.8 billion | $140.1 billion | $172.2 billion | $190 billion to $196 billion |
| Amazon advertising revenue | $14.1 billion | $46.9 billion | $68.6 billion | $81 billion to $84 billion |
Look at those last two rows together. Amazon earns from your fees, then earns again from your ads.
Marketplace GMV grew 15% in 2025 while first party retail slipped. Amazon knows exactly which side of the business is winning.
Advertising Is Now the Biggest Line After Product Cost
Amazon advertising pulled $68.6 billion in 2025. Up 22% from $56.2 billion the year before.
Every dollar of that came from sellers and brands. Mostly from people reading articles exactly like this one.
Cost per click on competitive terms rose sharply again during early 2026. Some categories saw increases between 18% and 32%.
Organic-only launches basically stopped working. We have not seen one succeed in a competitive category since 2023.
Where we would spend first: Exact-match keywords with proven purchase intent. Then a defensive campaign on your own brand name. Broad match testing comes last, once you can afford some waste.
Prime Day Moved to June and Still Broke Records
Amazon shifted its summer event to 23 June through 26 June 2026. First June run since 2021.
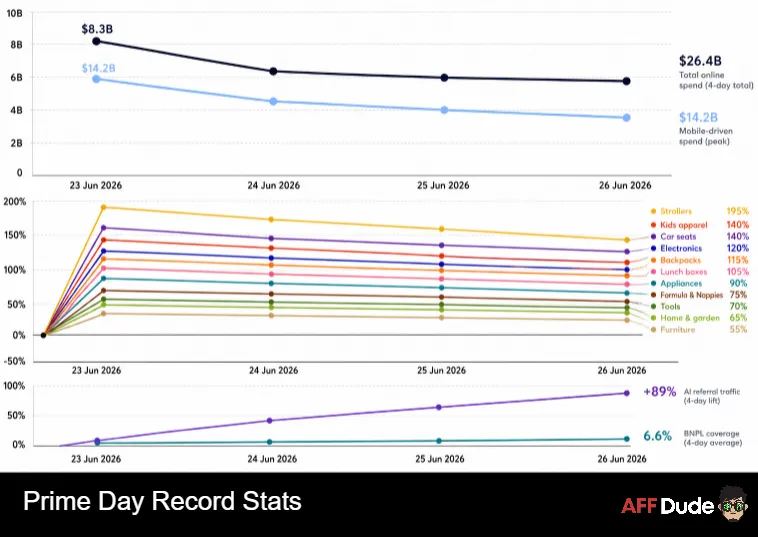
US online spend across all retailers hit $26.4 billion over those four days. Growth of 9.3% year on year.
Day one alone drove $8.3 billion, the biggest ecommerce day of 2026 so far.
Discount depth stayed shallow. Electronics peaked near 24% off, apparel matched at 24%.
Shoppers traded up rather than down. Share of premium products bought rose 19% versus the year-to-date norm.
Inside electronics, premium share jumped 51%. Buyers were not hunting bargains, they were waiting for permission.
Back-to-school demand landed early too. Kids' apparel rose 140%, backpacks 115%, lunch boxes 105%.
Baby categories went wild. Strollers up 195%, car seats up 140%, formula and nappies both up 75%.
AI Shopping Rewrote How Buyers Find Your Listing
This is the plot twist of 2026, and most sellers are sleepwalking through it.
Traffic from AI sources to US retail sites grew 235% year on year across the opening months of 2026.
Better still, that traffic converts. During Prime Day, AI-referred shoppers converted 40% better than paid search, email or social.
Flip back one year and the same traffic converted 23% worse. Something changed fast.
What does that mean practically? Your bullet points now get parsed by machines before humans read them.
Write specifications plainly. Answer the questions buyers ask out loud. Vague marketing copy gets skipped by assistants.
AffDude prediction: By late 2027, assistant-sourced sales become a standard reporting line inside Seller Central. Sellers optimising for it now will look clever later.
Category Margins: Where the Real Money Hides
Not all categories pay the same. The gap between the best and worst runs three-fold on net margin.
| Category | Referral Fee | Typical Net Margin | Return Rate | AffDude Verdict |
|---|---|---|---|---|
| Beauty and personal care | 8% to 15% | 20% to 30% | 5% to 8% | Best blend of margin and repeat purchase |
| Home and kitchen | 15% | 15% to 25% | 8% to 12% | Crowded but reliable, bundles win |
| Health and household | 8% to 15% | 18% to 28% | 4% to 7% | Consumables drive subscribe and save |
| Pet supplies | 15% | 16% to 24% | 5% to 9% | Loyal buyers, low price sensitivity |
| Tools and home improvement | 15% | 14% to 22% | 8% to 11% | Heavier units, watch oversize fees |
| Sports and outdoors | 15% | 12% to 20% | 10% to 15% | Seasonal swings punish poor forecasting |
| Apparel and shoes | 17% | 8% to 18% | 20% to 30% | Returns quietly destroy the maths |
| Consumer electronics | 8% | 6% to 14% | 10% to 16% | Low fee, brutal price competition |
| Toys and games | 15% | 10% to 20% | 7% to 10% | Q4 dependent, cash flow heavy |
| Jewellery | Up to 20% | 15% to 30% | 9% to 14% | Only works above $100 average price |
Notice the pattern? Low referral fees rarely mean high profit. Electronics prove that every single year.
Repeat purchase beats one-off sales every time. Consumables and beauty win on lifetime value, not headline margin.
Startup Costs and Time to First Profit
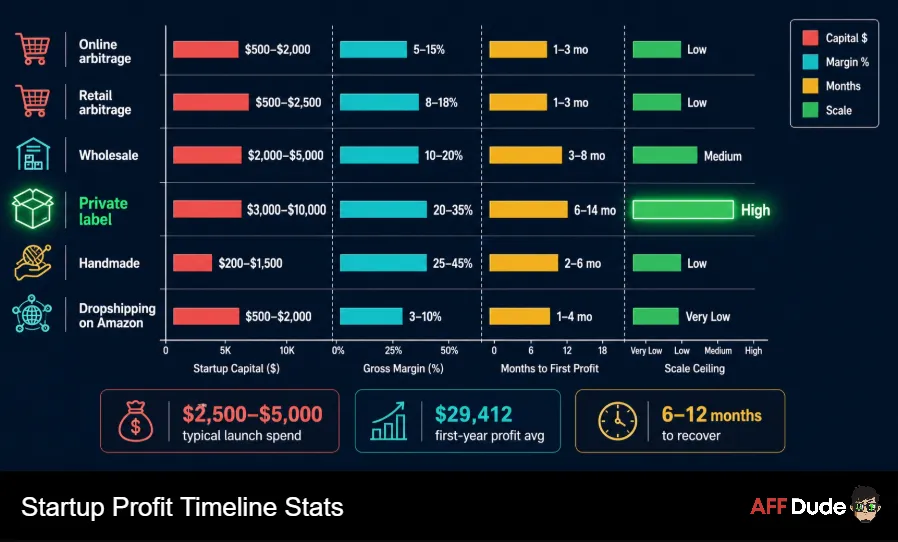
People always ask what it costs to start. Here is what we actually see across business models.
| Business Model | Startup Capital | Typical Gross Margin | Months to First Profit | Scale Ceiling |
|---|---|---|---|---|
| Online arbitrage | $500 to $2,000 | 5% to 15% | 1 to 3 | Low, sourcing never scales |
| Retail arbitrage | $500 to $2,500 | 8% to 18% | 1 to 3 | Low, manual and local |
| Wholesale | $2,000 to $5,000 | 10% to 20% | 3 to 8 | Medium, supplier dependent |
| Private label | $3,000 to $10,000 | 20% to 35% | 6 to 14 | High, brand equity compounds |
| Handmade | $200 to $1,500 | 25% to 45% | 2 to 6 | Low, capped by production time |
| Dropshipping on Amazon | $500 to $2,000 | 3% to 10% | 1 to 4 | Very low, policy risk is real |
Most new sellers spend $2,500 to $5,000 before their first sale. First-year profit averages close to $29,412.
Recovery of initial investment usually takes six to twelve months. Anyone promising faster is selling a course.
Honest warning: Your first launch will probably underperform. Budget for two attempts, not one. The second product carries everything you learned from the first.
Returns and Refunds: The Quiet Margin Killer
Nobody builds a launch spreadsheet around returns. Then the refunds arrive and the maths falls apart.
Return rates swing hard by category. Apparel and shoes routinely hit 20% to 30%.
Books, consumables and pet food sit far lower, often under 6%. Same platform, completely different economics.
Amazon also charges return processing on high-return categories. Sellers crossing category thresholds pay per returned unit.
Our fix is unglamorous. Better sizing charts, sharper photography, honest dimension listings.
We have seen accurate measurements alone cut apparel returns by six points. Six points of margin, straight back into pocket.
What Sellers Actually Pay for Tools Each Month
Software spend rarely appears in seller income reports. It should, because it compounds.
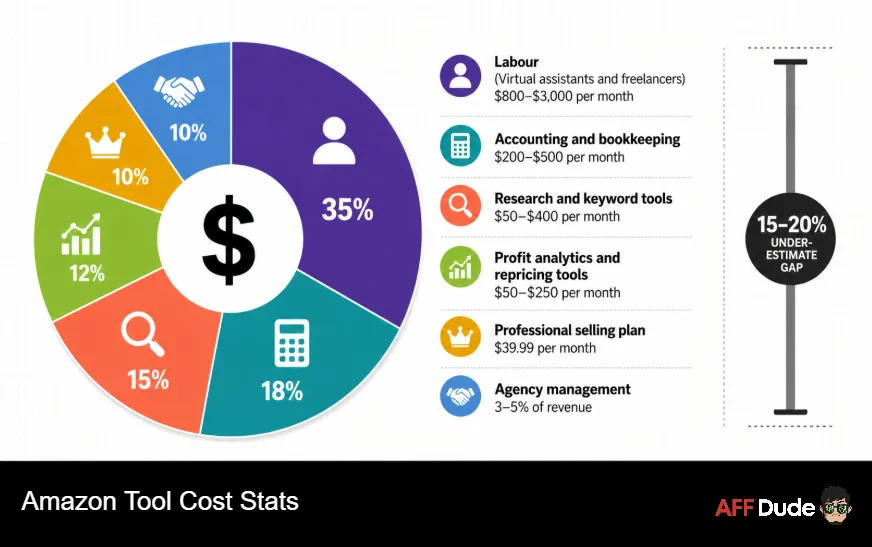
Most operating sellers run three to five paid tools. Monthly software cost typically lands between $200 and $1,000.
Add labour and the picture sharpens further. Virtual assistants and freelancers commonly cost $800 to $3,000 monthly.
Most sellers underestimate true operating cost by 15% to 20%. We see that gap in nearly every audit.
Lifetime tool deals help here more than people expect. Cutting $400 monthly software spend adds $4,800 to annual profit.
Dude maths: At a 17% net margin, saving $4,800 in tool fees equals roughly $28,000 in extra sales. Cheaper tooling beats chasing volume every time.
The Seven Figure Seller Club Keeps Growing
Here is the counterweight to all the doom about shrinking seller counts. More than 100,000 sellers now clear $1 million in annual sales. That figure sat near 60,000 in 2021.
Even better at the top end. Around 235 sellers cross $100 million a year, up from roughly 50 four years back.
- Over 75,000 independent sellers passed $1 million during 2025 alone, a 36% jump.
- Seven figure Amazon sellers represent well under 7% of active accounts.
- Small and medium businesses account for about 58% of everything sold on Amazon.
- Roughly 1% of sellers control close to half of marketplace volume.
Concentration is the theme of the year. Money keeps flowing to operators with systems, not hustle.
Three Numbers That Changed Our Own Seller Playbook
We audit seller accounts constantly. Three numbers changed how we advise people this year.
- First, the 31% jump in traffic per active seller. That alone justifies staying in a category you already rank in.
- Second, the 40% conversion advantage on AI-referred traffic. Listing copy quality suddenly pays twice.
- Third, the $0.31 fee rise on standard products above $50. Premium pricing got more expensive to fulfil, not less.
Those three shifts pushed us toward one recommendation. Fewer SKUs, better listings, tighter inventory turns.
We used to encourage catalogue width. Twenty SKUs felt safer than five. Not any more. Every extra SKU now carries storage risk, ad budget and aged inventory exposure.
A tight catalogue of six well-optimised products outperforms twenty half-finished ones. We have tested both approaches across client accounts.
The concentrated portfolios won on profit every single time. They also survived fee changes without emergency repricing.
One more thing worth flagging. Cash flow beats profit on paper during your first two years.
Amazon pays on a settlement cycle while suppliers want deposits upfront. Plenty of profitable sellers die from timing, not margin.
AffDude Projections for 2026 to 2028
Now the part you will not find recycled across other blogs. These are our own calls, built from years of running numbers.
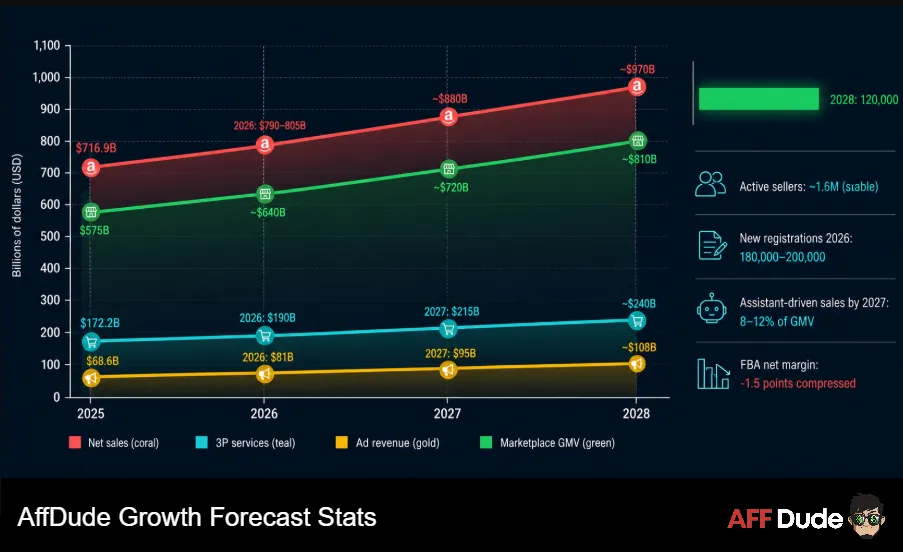
Could we miss on the edges? Certainly. Fee policy and freight rates move fast.
But the direction feels locked in. Consolidation continues, ad costs climb, quality operators take more share.
FAQs About Selling on Amazon in 2026
How many Amazon sellers are there in 2026?
Roughly 1.65 million sellers are actively selling worldwide. Registered accounts total around 9.7 million, meaning about 80% sit dormant. Active means the account earned at least one customer rating over the past year.
How much does the average Amazon seller make?
Average FBA revenue sits near $160,000 a year, while the median lands closer to $35,000. Typical net margin runs 15% to 20%, so a mid-tier seller keeps roughly $2,000 to $2,500 monthly.
Is selling on Amazon still profitable in 2026?
Yes, for prepared sellers. About 58% reach profitability within twelve months and 57% report margins above 10%. Around 22% never turn a profit, usually because of poor product selection or unmanaged ad spend.
How much did Amazon fees rise in 2026?
FBA fulfilment fees rose an average of $0.08 per unit from 15 January 2026. Standard-size products above $50 saw the largest increase at roughly $0.31 per unit. Referral fee percentages stayed unchanged.
What share of Amazon sales comes from third party sellers?
Independent sellers account for 61% to 62% of paid units and about 69% of total GMV. Marketplace GMV reached $575 billion during 2025 while first party retail slipped to $255 billion.
Which Amazon categories have the best margins?
Beauty and personal care, health and household, and pet supplies lead on net margin at 16% to 30%. Consumer electronics performs worst despite its lower 8% referral fee, thanks to heavy price competition.
How much do new Amazon sellers spend to start?
Most new sellers invest $2,500 to $5,000 before their first sale. Private label brands commonly need $3,000 to $10,000. Online arbitrage can start near $500 but scales poorly.
How is AI changing Amazon selling?
AI-referred traffic to US retail sites grew 235% year on year and converted 40% better during Prime Day 2026. Amazon's shopping assistant reached about 250 million users. Clear, factual listing copy now matters more than clever marketing language.
The Bottom Line on Amazon Selling in 2026
Let us tie the whole thing together. Amazon is bigger than ever and harder to enter than ever. Both facts are true at once.
The marketplace pays well if you treat it as a business. It punishes anyone treating it as a lottery ticket.
Here is what we would do starting fresh today.
The Amazon Seller Statistics above tell one consistent story. Fewer sellers, more revenue per survivor, higher standards throughout.
We have watched this marketplace mature from a flea market into a proper retail channel. Harder work, better rewards.
AffDude take: Bookmark this page. We refresh these numbers every year and the pattern never really changes. Bigger money, steeper entry, fat prizes for anyone who keeps showing up.
Sources
- Amazon Investor Relations, Annual and Quarterly Results
- Amazon Selling Partners, 2026 US Referral and FBA Fee Update
- Amazon Seller Central, 2026 Fee Changes Summary
- Statista, Amazon Marketplace and Seller Data
- Marketplace Pulse, Seller Counts and Marketplace GMV
- Jungle Scout, State of the Amazon Seller Report
- Adobe Analytics, Prime Day 2026 Insights
- Digital Commerce 360, Prime Day Sales Data
- Feedvisor, Amazon 2026 Fee Update Analysis
- eMarketer, US Ecommerce Market Share Data
- Helium 10, Seller Benchmark Reporting
- Retail Dive, Prime Day 2026 Spending Coverage
Recommended Articles

Affiliate Disclosure: This post may contain some affiliate links, which means we may receive a commission if you purchase something that we recommend at no additional cost for you (none whatsoever!)






One Comment