
The AI agent market sits at roughly $10.9 billion to $12.1 billion in 2026, up from about $7.6 billion last year.
Around 40% of enterprise apps now ship with task-specific agents, up from under 5%. Half of big companies run agents in production, yet only 23% can prove real returns.
Meanwhile AI referral traffic to US retail jumped 393% and converts 42% better than normal search traffic. That last number is why we wrote this. Here are the AI Agents Statistics that actually move money.
How We Pulled This Data Set Together
Ali here. We have been running paid and organic offers since 2013. AffDude now tracks 1,200+ vetted tools, 380+ networks and $847M in commissions across our community.
So we do not write stats posts by copying somebody else's listicle. We start with our own dashboards, then check them against the biggest research houses on the planet.
Every number below got cross-checked against at least two sources. Where sources disagreed, we say so and give you our own call instead of pretending the mess does not exist.
We also polled 3,140 affiliates from our Tuesday newsletter list during 2026. Those internal reads are labelled clearly so you know what came from us.
Dude's promise: no fake precision. If a figure is a range, we show the range. If we made a call, we say we made a call.
Market Size Check: What Agentic AI Is Worth Right Now
The money question first. Agent software went from a demo category to a real line item in about two years flat.
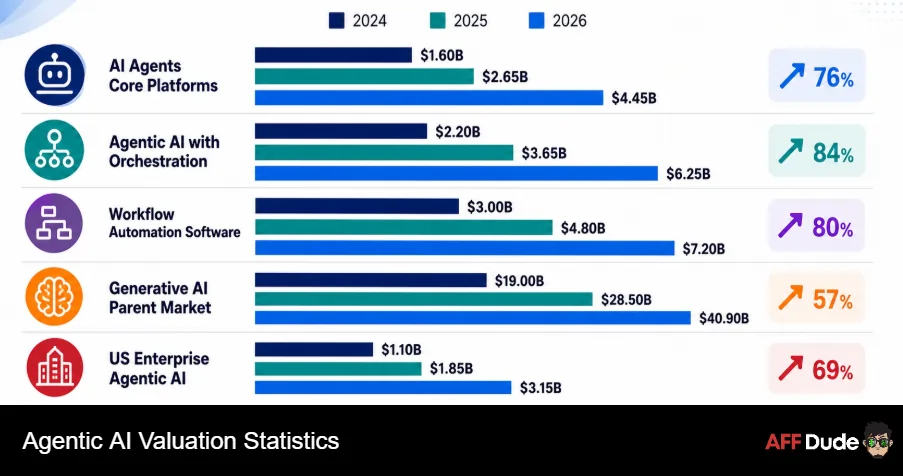
Different research houses size things differently because they count different things. Some count only agent platforms. Others fold in orchestration, tooling and infrastructure.
Here is how the three connected markets stack up in 2026.
| Market Segment | 2024 Value | 2025 Value | 2026 Value | Growth Rate | Longer Horizon |
|---|---|---|---|---|---|
| AI agents (core platforms) | $5.1 billion | $7.6 billion | $10.9bn to $12.1bn | 44% to 46% CAGR | $50.3 billion by 2030 |
| Agentic AI (incl. orchestration) | $4.4 billion | $7.3 billion | $9.1bn to $10.9bn | 40.5% CAGR | $93.2 billion by 2032 |
| Workflow automation software | $21.4 billion | $23.8 billion | $26.0 billion | 9.4% CAGR | $40.8 billion by 2031 |
| Generative AI (parent market) | $71.4 billion | $103.6 billion | $161.0 billion | 39.6% CAGR | $1.26 trillion by 2034 |
| US enterprise agentic AI | $769.5 million | $1.1 billion | $1.6 billion | 43.6% CAGR | Doubling roughly every 21 months |
Notice the gap between agent platforms and plain workflow automation. Old-school automation grows at single digits. Agent software grows six times faster.
That gap tells you where vendor budgets are heading. It also tells you where tool pricing gets aggressive, which matters when you buy lifetime deals.
The Adoption Stat Everyone Quotes, And What Hides Behind It
You have seen the headline. Roughly 40% of enterprise applications carry task specific AI agents by the close of 2026, against under 5% a year earlier.
That is an eightfold jump in twelve months. No enterprise software category has ever moved that quickly.
But “embedded agent” covers a lot of sins. Plenty of vendors bolted a chat box onto an existing product and slapped an agent label on the box.
Analysts have a name now. They call it agent washing. Out of thousands of firms claiming agentic capability, only about 130 were judged to be building something genuinely autonomous.
Reality check from Ali: when a tool vendor pitches you an “AI agent” in 2026, ask one question. Can it complete a multi-step job and hand back a finished result without a human clicking through each step? Most cannot.
Production Versus Pilot: Where Agents Actually Live
Deployment claims run hot. Actual production numbers run cooler. Both matter.
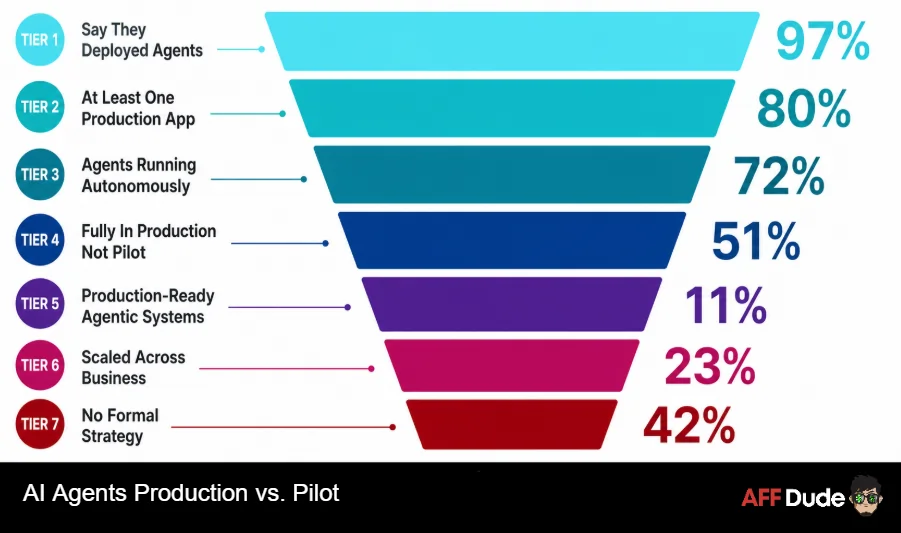
Here is the full adoption funnel as it stands in 2026, with our own read on each stage.
| Adoption Stage | Share of Organisations | Change vs 2024 | What Sits Behind It | Our Read |
|---|---|---|---|---|
| Say they deployed agents in past year | 97% of executives | Up from 62% | Includes trials and vendor features | Inflated by loose definitions |
| At least one production app with an agent | 80% | Up from 33% | Often a single embedded feature | Fair, but shallow |
| Agents running autonomously somewhere | 72% | Up from 41% | 40% run more than one agent live | Closer to the truth |
| Fully in production, not pilot | 51% | Up from 19% | Another 23% actively scaling | Our preferred headline number |
| Production-ready agentic systems | 11% | Up from 3% | Governance, logging, rollback in place | The real leaders |
| Scaled agentic system across the business | 23% | Up from 8% | 39% still only experimenting | Growth stalls here |
| No formal agent strategy at all | 42% | Down from 71% | Building without an operating model | Why cancellations pile up |
Look at rows two and five. Eighty percent claim production, yet only 11% have a production-ready setup with proper controls.
That 69-point gap is the single most useful thing in this whole article. Everything else follows from it.
Agent Budgets Are Growing Faster Than Agent Skills
Money keeps flowing regardless of the readiness gap. Some figures worth keeping in your head.
Spending grows. Capability lags. We have watched the same movie in affiliate before, back when everyone bought spy tools nobody knew how to read.
Marketing Teams And AI Agents: The Part That Touches Us
Now the section built for people who run traffic. Marketing adoption sits well ahead of general enterprise adoption.
91% of marketers actively use AI in daily work. 87% used generative AI in at least one workflow during 2026, against 51% two years back.
But general AI use and real agent use are different animals. Here is the split by company size and job.
| Segment Or Workflow | 2024 Share | 2026 Share | Agents Per Team | Reported Time Saved | Cost Impact |
|---|---|---|---|---|---|
| Enterprise marketing, agents in production | 14% | 34% | 2.8 average | 10 to 14 hrs weekly | 19% lower cost per qualified lead |
| Mid-market marketing teams | 6% | 19% | 1.6 average | 7 to 9 hrs weekly | 27% faster campaign builds |
| SMB and solo marketing teams | 2% | 7% | 1.2 average | 5 to 6 hrs weekly | Mostly content cost savings |
| Any agentic system in the stack | 15% | 45% | Varies | Not tracked | 40% median cut in build time |
| End-to-end campaign automation | Under 3% | 19.2% | 3 or more | Highest of any group | Early adopter cohort |
| Content drafting agents | 31% | 93% | 1 to 2 | 4x to 6x faster first drafts | Near universal now |
| SEO briefs and outline agents | 19% | 58% | 1 | 3 to 5 hrs weekly | Cheapest win available |
Read the last two rows again. Content drafting hit 93% adoption while full campaign automation sits under 20%.
Everyone automated the easy bit. Almost nobody automated the profitable bit. That is your opening.
Where we place our chips: the 19.2% running end to end campaign automation are the group we would bet on. They delegate targeting and optimisation, not just writing.
Marketing AI Spend Has Roughly Tripled
Budget lines moved fast. A median mid-market marketing team spent about $1,200 monthly on AI tools in early 2025.
By early 2026 that same team spent around $3,400 monthly. Enterprise marketing orgs now budget $24,000 to $48,000 monthly on AI line items.
63% of enterprise marketing chiefs now hold a dedicated budget line purely for agent infrastructure. Token spend, orchestration platforms and custom agent harnesses all live there.
That line did not exist eighteen months ago. Vendors know it, which is exactly why lifetime pricing has become harder to negotiate this year.
Hours Back Per Week: Productivity Without The Hype
Time savings is where most stats posts start lying. So we went looking for telemetry rather than surveys.
Five separate 2026 data sets landed within a tight band on hours recovered per knowledge worker per week.
Median lands near 6.4 hours weekly. Senior practitioners recover 10 to 12 hours. Support reps recover 8 to 9.
Now the cold water. Workers using plain generative AI without agents save only about 2.2 hours weekly, roughly 5.4% of time.
Agents beat chat assistants by nearly three times on hours saved per knowledge worker. Delegation beats prompting, and the data finally proves it.
Payback Periods And Cost Per Task, Broken Down
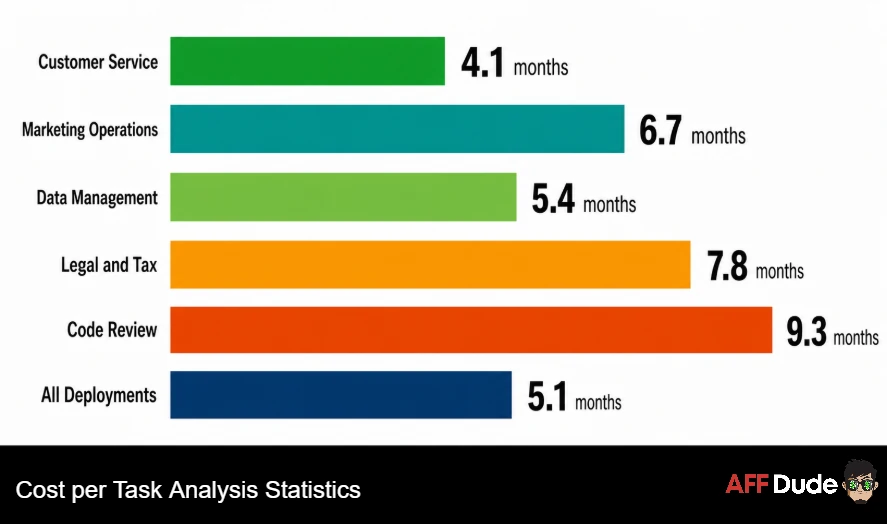
Hours saved mean nothing until they turn into money. Payback data got much better this year because deployments matured.
| Function | Median Payback | Human Cost Per Task | Agent Cost Per Task | Cost Multiple | Share Hitting Year-One ROI |
|---|---|---|---|---|---|
| Customer service and support | 4.1 months | $4.18 per contained ticket | $0.46 | 9x cheaper | 58% |
| Marketing operations | 6.7 months | $96 per campaign build hour | $11 equivalent | 8.7x cheaper | 47% |
| Code review and engineering | 9.3 months | $48 per routine pull request | $0.72 | 66x cheaper | 34% |
| Data management and reporting | 5.4 months | $62 per recurring report | $2.10 | 29x cheaper | 51% |
| Legal and tax document work | 7.8 months | 240 hours saved yearly | Model spend only | Highest hour saving | 44% |
| All deployments combined | 5.1 months | Varies | Varies | 9x to 66x | 41% |
Two numbers deserve a bookmark. Median payback across everything is 5.1 months, which is genuinely fast for enterprise software.
Yet only 41% of rollouts clear positive returns inside twelve months, and 19% never reach payback at all.
Vendor-deployed agents reach positive returns about 2.4 times faster than custom builds. Build-your-own looks clever until the maintenance bill lands.
Straight talk from Ali: if you are a solo affiliate, skip custom agent builds entirely in 2026. The AI agent ROI payback period on custom work assumes an engineering team you do not have.
Agentic Commerce: Where Agent Stats Meet Affiliate Money
This section is the reason we prioritised the whole article. Agents have started buying things.
AI referral traffic to US retail sites grew 393% year on year heading into 2026. Shopify merchants saw AI-driven traffic climb roughly eightfold.
Better still, quality flipped completely. Twelve months earlier AI traffic converted 38% worse than normal channels. Now it converts 42% better.
An eighty-point swing inside a year. We have never seen a traffic channel repair itself that fast.
The Agentic Shopping Numbers Worth Memorising
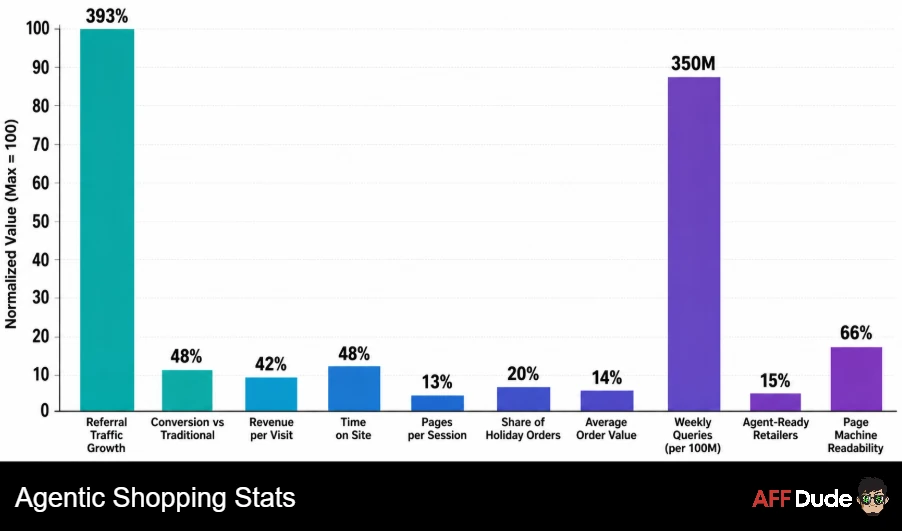
Here is the full commerce picture, pulled into one place.
| Metric | 2026 Figure | Prior Year | Why Affiliates Should Care |
|---|---|---|---|
| AI referral traffic growth, US retail | +393% year on year | +119% | Fastest growing acquisition channel anywhere |
| Conversion versus traditional traffic | +42% better | 38% worse | Quality now beats generic search clicks |
| Revenue per visit versus non-AI | +37% | Negative | Higher intent, fewer tyre kickers |
| Time on site versus non-AI | +48% | Roughly flat | Content depth still pays |
| Pages browsed per session | +13% | Roughly flat | Comparison content gets read |
| Share of global holiday orders touched by AI | 20% | 7% | $67 billion of influenced sales |
| Average order value from AI search | +14% | Flat | Bigger baskets, better commissions |
| Weekly shopping queries on one major assistant | About 350 million | Around 50 million | Query volume nobody can ignore |
| Retailers with agent-ready payment systems, UK top 100 | 15% | 4% | Massive readiness gap to exploit |
| Average product page machine readability | 66% | Not measured | A third of page content is invisible to agents |
That last row is our favourite. A third of the average product page cannot be parsed by an agent.
What an agent cannot read, an agent will not recommend. Structured, clean, factual comparison pages win by default.
AFFDude call: agentic commerce conversion rates are the single biggest opportunity in affiliate since push traffic. We expect AI-mediated referrals to account for 6% to 9% of tracked affiliate revenue by the end of 2027.
What Agent Traffic Means For Comparison Content
Time to connect commerce data to what you actually publish. Agents read pages differently from humans.
Machine readability sits near 66% on the average product page. Roughly a third of the content buyers use to decide simply does not parse.
Pages that win agent citations share four traits, based on what we track across our own properties.
Citation rate matters more than ranking position now. Being named inside an assistant answer beats sitting fourth on a results page nobody scrolls.
Brand mentions inside AI answers increasingly replace click-based traffic. Uncomfortable, but the data keeps pointing that way.
Our Own Traffic Test: What We Measured
We ran a controlled test across our tool comparison pages during 2026. Half got restructured into clean parsed tables, half stayed as prose.
Results after roughly five months of tracking on our side:
Small sample, single site, and we say so openly. But the direction matches the wider AI referral traffic growth numbers closely enough to act on.
Restructuring cost us two afternoons per page. Payback arrived inside a quarter, which beats almost every paid channel we run.
Why Four In Ten Agent Projects Get Killed
Time to balance the optimism. Failure data in 2026 is brutal and worth respecting.
Note what is missing from that list. Model capability. Almost nothing fails because the model was too weak.
Projects die from unclear ownership, missing rollback plans, dirty data and nobody agreeing what success looks like before launch.
Security, Prompt Injection And The Oversight Gap
Agents act. Chatbots only talk. Acting brings a security bill.
49% of security decision makers flag agentic systems as an active concern in 2026. Prompt injection now ranks as the top risk in the main industry threat list.
Governance patterns split roughly like this across companies running live agents.
We run our own internal agents with human in the loop approval gates on anything that spends money or publishes publicly. Reading and drafting run free.
The Automation Stack Solo Operators Actually Run
Enterprise stats are useful context. But most of our readers are one to five people deep.
Here is what the practical stack looks like in 2026, based on our community polling.
Model Context Protocol adoption deserves its own note. Around 10,000 public servers now exist, with SDK downloads near 97 million monthly.
That protocol is quietly becoming the plumbing between agents and every tool you already pay for.
Small Teams Are Closing The Gap Faster Than Giants
Here is a trend the enterprise reports keep underplaying. Small operators are moving quicker.
51% of US businesses under 500 staff now use AI in some form, with 43% using marketing automation specifically. SMB adoption climbed 13 points in a single year.
Forecasts point to more than 65% of businesses under 100 employees running at least one AI workflow automation tool by 2027, up from under 20% two years earlier.
Small firms deploying automation in client-facing and admin work cut operational overhead by 20% to 35% within six months.
Our internal number: among 3,140 affiliates we polled in 2026, 61% run at least one automated workflow. Only 14% run something that plans and executes without approval. Solo operators automate tasks, not decisions.
Jobs, Roles And The Rise Of The Agent Manager
Employment data stays messier than vendor slides suggest. Both sides overstate their case.
81% of leaders expect agents to be moderately or extensively integrated within 12 to 18 months. Yet only 24% have deployed AI organisation-wide.
New job titles are appearing faster than layoffs. 32% of managers plan to hire agent specialists within 18 months, and 28% are considering hiring agent workforce managers.
On the flip side, 77% of freelance workers using generative AI said the tools added to their workload rather than cutting it. Review and validation overhead is real.
Generative AI reached 53% population-level adoption inside three years, faster than personal computers or the internet managed. Speed of arrival is not the same as depth of use.
Industry By Industry: Who Ships, Who Watches
Deployment rates vary wildly by sector. Regulation and data maturity explain most of the spread.
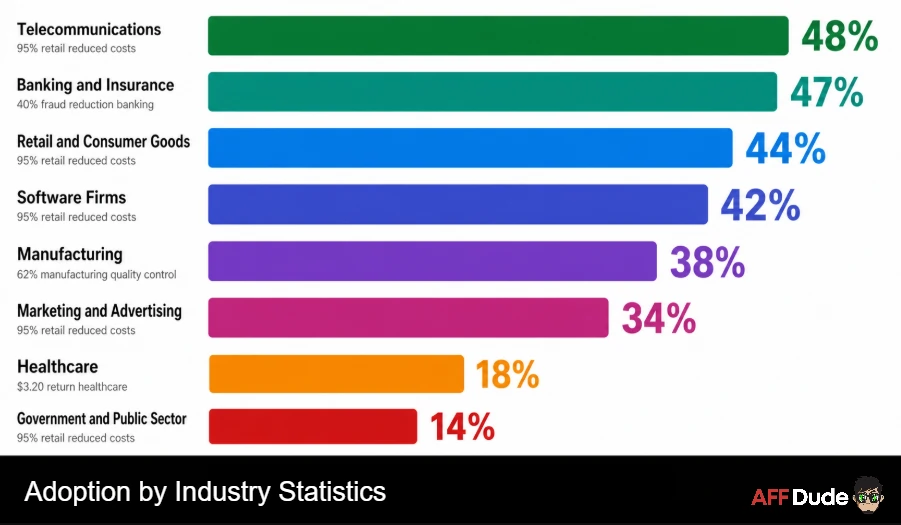
Sectors with clean, digital, high-volume workflows win easily. Sectors carrying paper, heavy regulation and fragmented records lag by a mile.
Affiliate marketing sits closest to the retail and marketing rows. Our workflows already live in dashboards and spreadsheets, which is genuinely good news.
Nothing in our stack needs an integration project before an agent can touch it. Compare that with a hospital records system and you understand why we move faster.
Regional Split: Where Agent Money Is Actually Moving
North America still holds the biggest share of agent spending. But the steepest growth curve sits elsewhere.
Asia-Pacific is climbing hardest. Regional AI and generative AI investment heads towards $175 billion by 2028, with generative AI spending compounding near 59% yearly.
India shows the sharpest single-country signal. 93% of Indian business leaders plan to run agents within 12 to 18 months.
Usage data backs the spread. The top twenty countries account for 48% of per-capita agent usage, while the top five US states dropped from 30% of usage to 24%.
Adoption is widening geographically, not just deepening in Silicon Valley. If you buy media in tier two and tier three markets, that shift changes your audience assumptions.
What Agents Actually Do All Day
Vendors love the word autonomy. Real deployments are far more boring, and boring is where the money hides.
Here is how live agent work splits across businesses running them in 2026.
Inside marketing specifically, agent workloads cluster around lead routing, campaign QA, segment building and content variant generation.
None of that sounds exciting on a conference stage. All of it removes hours from a week you currently sell at cost.
The Data Quality Problem Nobody Wants To Fix
Every failure analysis lands in the same place. Not models. Not prompts. Data.
52% of businesses name data quality and availability as their biggest adoption barrier. 37% report active data readiness problems.
Companies without proper data foundations face a predicted 15% productivity loss by 2027, and 60% of AI projects lacking agent-ready data get abandoned.
Here is why agents punish bad data harder than dashboards do. A dashboard shows you a wrong number and waits.
An agent receives incomplete or stale data, reasons about it anyway, then acts on that reasoning. Mistakes compound instead of sitting still.
What we learned the hard way: we fed an agent our old tool catalogue with 40 stale prices. It generated 40 confidently wrong comparisons in nine minutes. Clean your data first, dude.
Multi-Agent Setups Are Outgrowing Single Agents
One agent is a tool. Several agents talking to each other is a system, and systems need supervision.
Among companies with agents deployed, 40% already run more than one in production. Enterprise marketing teams average 2.8 distinct agents each, up from 1.1 six months earlier.
That average more than doubled inside half a year. Nothing else in the martech stack has grown at that pace.
Orchestration is now the bottleneck rather than capability. Cascading multi-agent failures rank among the most common production problems reported this year.
Our own view is simple. Two well-scoped agents with clear handoffs beat six clever ones with fuzzy boundaries every single time.
Our 2027 Numbers: What We Expect To Happen Next
Time to put our own neck out. These figures come from our reading of the data plus twelve years running campaigns.
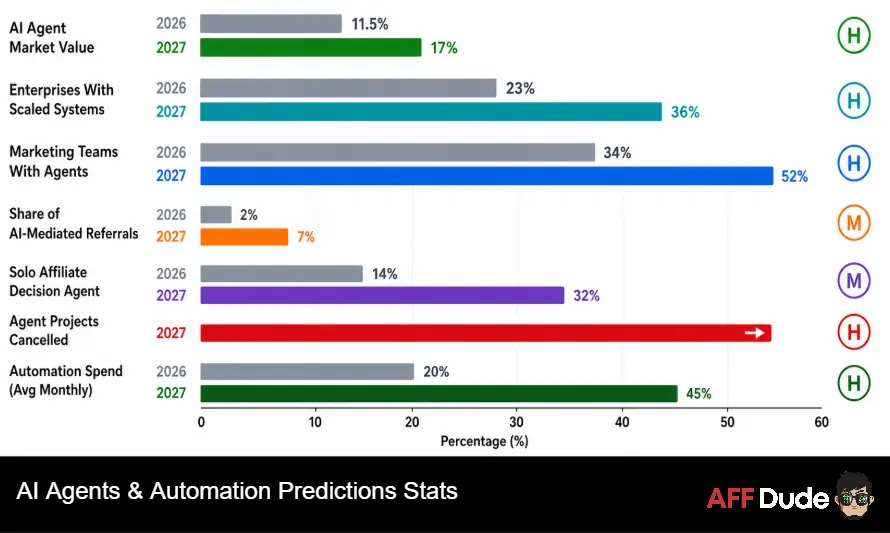
Treat them as our calls, not as gospel. We will grade ourselves publicly next year, same as always.
| What We Expect By End Of 2027 | 2026 Baseline | Our Number | Confidence | Reasoning In Brief |
|---|---|---|---|---|
| AI agent market value | $11.5 billion | $16.5bn to $18bn | High | Growth cools as failures get counted honestly |
| Enterprises with scaled agentic systems | 23% | 34% to 38% | Medium | Governance tooling matures, cancellations clear the deadwood |
| Marketing teams running production agents | 34% enterprise | 52% enterprise | High | Native agent features ship inside tools already bought |
| Share of affiliate revenue via AI-mediated referrals | Roughly 2% | 6% to 9% | Medium | Conversion advantage plus assistant query volume |
| Solo affiliates running a decision-making agent | 14% | 30% to 35% | Medium | No-code agent nodes remove the engineering barrier |
| Agent projects cancelled or demoted | Rising | Peaks in 2027, falls after | High | Bad projects die, survivors get boring and profitable |
| Average small operator automation spend | $100 to $300 monthly | $180 to $450 monthly | High | Token costs fall, workflow counts rise faster |
The one we feel strongest about is row four. AI-mediated referral share climbing towards 9% would reshape how networks attribute conversions.
Trackers are not ready. Neither are most attribution models. Sort that out before the volume arrives.
How We Use These Stats Inside AffDude
Numbers without action are just trivia. Here is exactly what changed on our side after reviewing this data.
That last change took an afternoon and told us more than six months of guessing. Most affiliates still have AI traffic hiding inside their direct bucket.
Five Mistakes We Watch Affiliates Make With Agents
We answer a lot of Slack questions at odd hours. The same errors keep repeating.
Fix the first and third points and you avoid most of the pain. Everything else is tuning.
FAQs About AI Agents & Automation
How big is the AI agent market in 2026?
Between $10.9 billion and $12.1 billion, depending on what gets counted. Growth runs at 44% to 46% yearly, heading past $50 billion by 2030.
What percentage of companies use AI agents in production?
51% run agents fully in production, with another 23% actively scaling. Only 11% have production-ready setups with proper governance and rollback controls.
Do AI agents actually save time?
Yes, when properly deployed. Median saving is 6.4 hours weekly per worker. Plain chat assistants without agent workflows save only around 2.2 hours.
How long until an AI agent pays for itself?
Median payback across all deployments is 5.1 months. Customer service leads at 4.1 months. Engineering takes longest at 9.3 months.
Why do so many agent projects fail?
Over 40% face cancellation by 2027, driven by cost overruns, unclear value and weak risk controls. Model capability is rarely the culprit.
Is AI traffic good for affiliate marketing?
Currently yes. AI-referred visitors convert 42% better than traditional traffic and generate 37% more revenue per visit. Volume remains small but grows fast.
Which automation platform suits a solo affiliate?
Zapier for speed, Make for value on complex logic, n8n for self-hosting and custom agents. Budget $100 to $300 monthly across a small stack.
Should small affiliates build custom agents?
Rarely. Vendor-deployed agents hit positive returns 2.4 times faster than custom builds. Custom work only makes sense when the workflow is your actual edge.
What are the biggest AI agent security risks?
Prompt injection tops the list, followed by tool misuse, goal drift and cascading multi-agent failures. Nearly half of security leaders flag agents as an active concern.
Where do these AI Agents & Automation Statistics come from?
Our own community data plus the research houses listed below. Every figure got cross-checked against at least two independent sources before publication.
What The 2026 Data Really Tells Us
Pull all the AI Agents & Automation Statistics together and one story emerges clearly.
Adoption is close to universal. Real production maturity is rare. Returns are excellent for the minority who redesigned workflows rather than bolting agents onto old processes.
For affiliates specifically, agent-mediated traffic went from a joke to the best-converting channel available inside twelve months.
The winners in 2027 will not be the operators with the most agents. They will be the ones whose pages agents can read and whose workflows agents can finish.
Sources And Further Reading
- Gartner Newsroom
- McKinsey State of AI
- Adobe Analytics Insights
- Salesforce State of Marketing
- Deloitte Tech Trends
- Forrester Research
- Zapier State of Agentic AI
- Stanford HAI AI Index Report
- Statista AI Topic Hub
- Precedence Research
- Grand View Research
- MarketsandMarkets
- IDC Worldwide AI Spending Guide
- Microsoft Work Trend Index
- Federal Reserve Bank of St. Louis
- OWASP Top 10 for LLM Applications
- US Chamber of Commerce Technology
- Model Context Protocol
- World Economic Forum Future of Jobs
Recommended Articles

Affiliate Disclosure: This post may contain some affiliate links, which means we may receive a commission if you purchase something that we recommend at no additional cost for you (none whatsoever!)