
Email marketing still returns more per dollar than any channel you can rent. In 2026 the average sits between $36 and $42 for every $1 spent, and retail lists clear $45. That kind of email marketing ROI is exactly why the inbox refuses to die.
Reach backs it up. Around 4.7 billion people now use email, and 392.5 billion messages move every day. Automated flows drive close to 41% of email revenue from just over 5% of sends, so the real money lives in sequences, not blasts.
Open rates turned unreliable the moment privacy tools started inflating them, so click-through rate and conversion now decide who wins. This roundup of Email Marketing Statistics 2026 pulls the benchmarks we track weekly, from deliverability to revenue per subscriber, plus our own calls on where the channel heads next.
The 2026 Email Scoreboard Worth Pinning Above Your Desk
We run email across affiliate, SaaS and DTC offers, and these figures come up in almost every strategy call. So we built one clean table you can screenshot before your next client meeting.
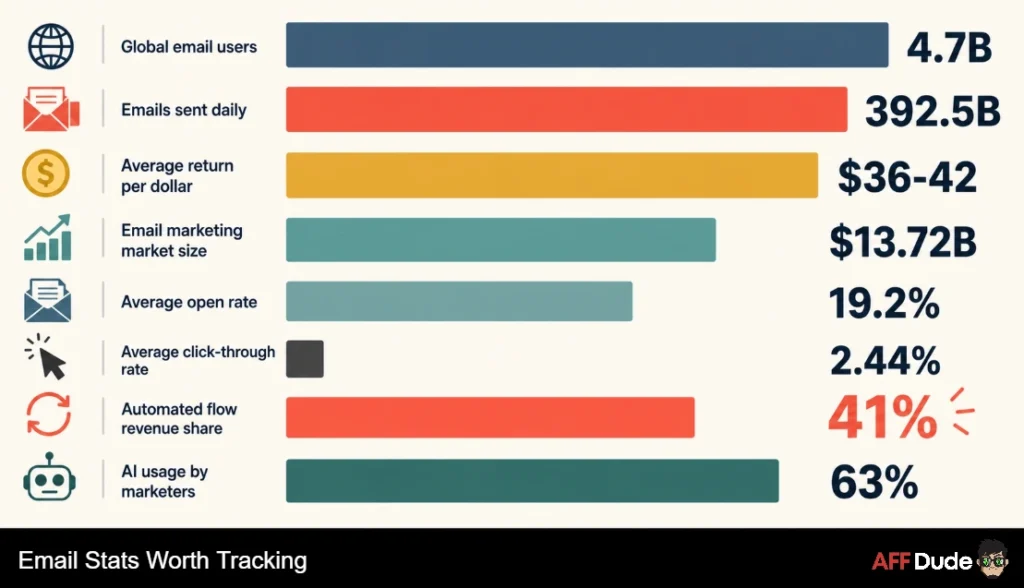
No fluff. Just the headline figures that decide budget arguments.
| Metric | 2026 figure | Why any marketer should care |
|---|---|---|
| Global email users | 4.7 billion | Around 58% of everyone alive |
| Emails sent and received daily | 392.5 billion | Up from 376.4 billion last year |
| Average return per $1 spent | $36 to $42 | Still the best in digital |
| Email marketing market size | $13.72 billion | Growing near 11% a year |
| Average open rate, all industries | 19.2% to 20.7% | Privacy tools inflate reported figures |
| Average click-through rate | 2.44% | Real engagement signal |
| Share of revenue from automated flows | 41% | Built once, earns forever |
| Marketers using AI in email | 63% | Regular daily use sits far lower |
Look at row seven again. Forty-one percent of revenue from a sliver of your sending volume. That single line explains why we spend most of our email hours on flows, not blasts.
AffDude take: Chasing a bigger list before fixing your flows is like buying paid traffic with a broken landing page. Fix the machine first. We rebuilt our welcome sequence before touching acquisition, and revenue per subscriber jumped inside a month.
How Many People Actually Sit In The Inbox Right Now
Start with reach, because reach sets your ceiling. Around 4.7 billion people will use email in 2026. That works out near 58% of the global population.
Daily volume hits roughly 392.5 billion messages. Back in 2024 that figure sat at 361.6 billion. By 2028 it heads past 424 billion, growing about 4.2% a year.
Accounts outnumber humans by a wide margin. Most users keep 1.86 addresses on average, which puts total accounts above 8.7 billion.
Inbox reach at a glance in 2026:
Gmail dominates, holding close to 1.8 billion active users. Outlook follows with over 400 million, then Yahoo Mail near 225 million.
Here comes the annoying part. Office workers receive about 121 emails per day. So your message lands in a crowded room, every single time.
Email Marketing Revenue And Market Size In 2026
Money follows attention, and email keeps pulling both. Global email marketing revenue sits around $13.72 billion in 2026, climbing near 11% year on year.
Forecasts stretch differently depending on what each report counts. Software plus services pushes the wider category toward $22.93 billion by 2031. Broader models running to 2033 land above $36 billion.
Our own read on the money side:
That last figure matters more than it looks. Send 500,000 emails a year and small per-message gains turn into real profit.
Straight from the Dude: Software cost is never your bottleneck. Most affiliates we speak to pay $50 to $200 a month for their sending tool while leaking thousands through bad deliverability. Audit the plumbing before upgrading the platform.
Return Per Dollar: Why Email Keeps Printing Money
Now the number every client asks about first. Email marketing ROI benchmarks land between $36 and $42 for every $1 spent in 2026.
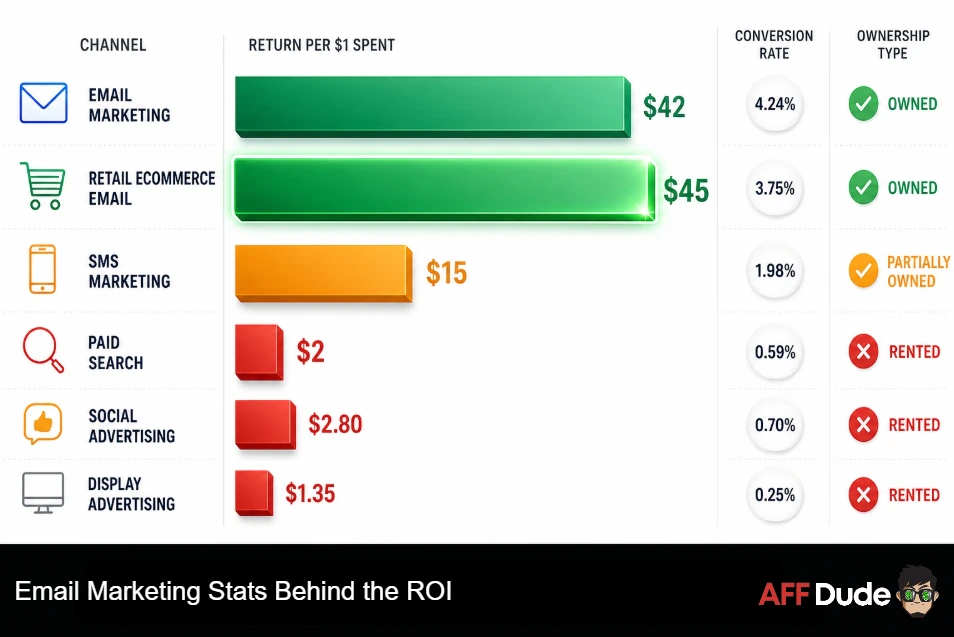
Retail and ecommerce lists perform better, averaging near $45. Some US merchant cohorts report figures as high as $68.
Compare that with paid channels and the gap gets silly.
| Channel | Average return per $1 | Typical conversion rate | Cost trend in 2026 | Owned or rented |
|---|---|---|---|---|
| Email marketing | $36 to $42 | 4.24% | Flat, near $0.0005 per send | Fully owned |
| Retail and ecommerce email | Around $45 | 3% to 5% | Flat | Fully owned |
| SMS marketing | $8 to $20 | 2% to 4% | Rising, $0.007 plus per message | Owned, higher cost |
| Paid search | Around $2 | 3.75% | Rising fast | Rented |
| Social advertising | Around $2.80 | 0.59% | Rising | Rented |
| Display advertising | Around $1.35 | 0.7% | Flat, low intent | Rented |
Read the last column carefully. Paid channels rent you attention. Email hands you an asset nobody can switch off.
Roughly 81% of small and midsize businesses still name email as their main acquisition channel. After twelve years in performance marketing, we have never seen a cheaper way to reach buyers twice.
Here comes the catch. Close to half of companies admit they measure email return badly or skip measuring completely. So plenty of teams sit on profit they cannot even see.
AffDude reality check: Nobody hits $42 by accident. That average hides brilliant senders and terrible ones. Our best offer lists clear it comfortably. Our lazy ones do not, and we deserve that.
Open Rate Benchmarks By Industry, And Why Copying Them Backfires
Time for the metric everyone quotes and nobody trusts anymore. Across all industries, average email open rate figures land between 19.2% and 20.7%.
Add Apple Mail Privacy Protection and reported opens jump near 33.9%. Apple preloads images, so opens register even when nobody reads.
Top performers reach around 44%. Government senders lead on raw opens at 30.5%, ahead of nonprofits at 25.2%.
| Industry | Average open rate | Average click-through rate | Unsubscribe rate | What we watch instead |
|---|---|---|---|---|
| Government and public sector | 30.5% | 3.5% | 0.4% | Reply and action rates |
| Nonprofits and charities | 25.2% | 2.9% | 0.5% | Donation conversion |
| Education | 23.4% | 2.6% | 0.6% | Enrolment clicks |
| Software and web apps | 22% to 25% | 1.2% | 0.9% | Trial starts |
| Legal and professional services | 21% | 4.9% | 0.5% | Consultation bookings |
| Retail and ecommerce | 18% to 26% | 1.5% to 3% | 1% | Revenue per recipient |
| Finance and insurance | 20% | 2.4% | 0.8% | Application completions |
| Health and wellness | 19% | 2.2% | 0.9% | Repeat purchase rate |
| Travel and hospitality | 18% | 2% | 1.1% | Booking value |
| Media and publishing | 22% | 3.1% | 0.7% | Click-to-open rate |
| All industries combined | 19.2% to 20.7% | 2.44% | 0.89% | Clicks and conversions |
One warning before you benchmark yourself. Every platform measures differently, and each dataset carries its own bias.
So treat industry figures as a rough sanity check. Your own three month rolling average beats any published table.
AffDude Insight: Stop reporting opens to clients. We swapped ours for clicks, conversions and revenue per recipient two years back. Uncomfortable meeting once. Much better conversations ever since.
Click Rates And Click To Open Ratio Now Run The Show
If the opening went soft, clicks carry the weight. Average click-through rate sits at 2.44% across industries in 2026.
Click-to-open rate benchmarks hover between 5.3% and 6.8%. Strong campaigns push past 10%, and manufacturing lists lead near 14.8%.
Automated messages beat broadcasts easily. Transactional and triggered sends average 30.6% opens with a 7.39% click rate.
Click metrics we actually report on:
Email conversion sits near 4.24%, against 0.59% for social. So fewer eyeballs, far better buyers.
One more figure worth noting. Click-to-conversion rates rose sharply through 2024 and held gains since, jumping from 5.9% to around 9%.
We expect click-through rates to keep drifting upward through 2027. Better targeting plus smaller, sharper segments does that.
Automated Flows Beat Broadcast Campaigns, Badly
Here comes the biggest gap in email today. Automated sequences generate near 41% of total email revenue from only 5.3% of sends.
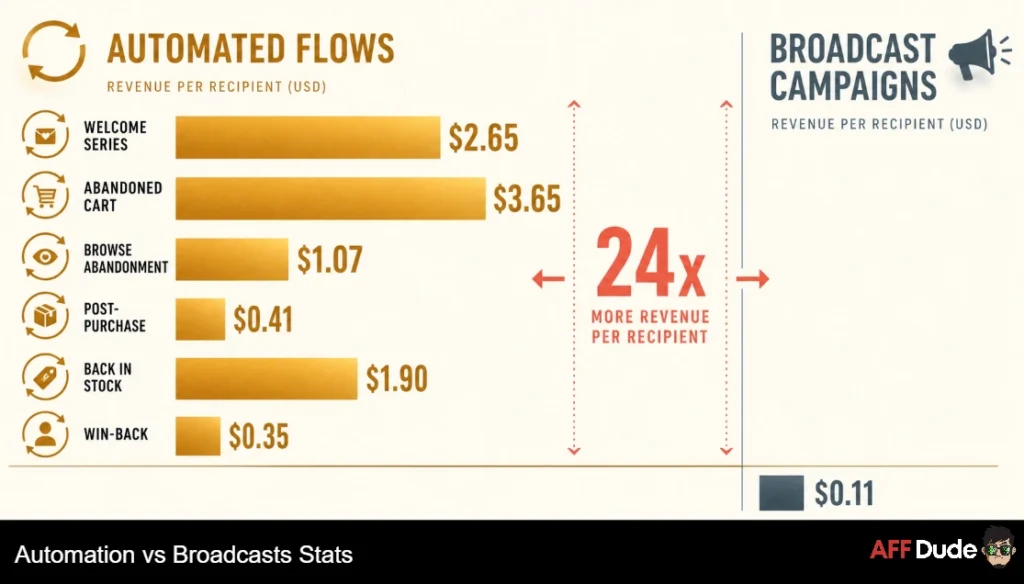
Flows deliver roughly 3x higher click rates than campaigns, 5.58% against 1.69%. Placed order rates run around 13x higher.
Revenue per recipient tells an even sharper story.
| Flow type | Average open rate | Average click rate | Revenue per recipient | Top 10% revenue per recipient |
|---|---|---|---|---|
| Welcome series | 83.6% | 8% to 12% | $2.65 | $21.18 |
| Abandoned cart | 50.5% | 6.25% | $3.65 | $28.89 |
| Browse abandonment | 40% to 45% | 4% | $1.07 | $8.40 |
| Post-purchase | 40% to 45% | 3.5% | $0.41 | $3.10 |
| Back in stock | 59.2% | 5.3% | $1.90 | $9.60 |
| Win-back and re-engagement | 25% to 30% | 2.5% | $0.35 | $2.80 |
| Standard broadcast campaign | 19% to 21% | 1.69% | $0.11 | $0.90 |
Compare the top row with the bottom row. A welcome sequence earns roughly 24 times what a random newsletter blast earns per person.
Three flows carry most of the load:
Together those three account for about 87% of all automated orders. Cart sequences alone recover 3% to 5% of lost sales, and a three message sequence recovers around 69% more orders than a single reminder.
Ali's honest note: Affiliates skip flows because offers rotate. Wrong move. Build offer-agnostic sequences that sell your judgement first, then swap the links. Ours have survived four network changes without a rewrite.
Deliverability Got Strict, And Sloppy Senders Are Paying
This section costs people the most money, so read it twice. Authenticated domains reach the inbox around 89% of the time. Unauthenticated senders drop to roughly 44%.
That 45 point gap is the single largest lever available to most senders. Yet adoption stays patchy.
| Deliverability factor | 2026 position | Risk when ignored | Our fix priority |
|---|---|---|---|
| SPF and DKIM records | 66.2% of senders use both | Inbox placement halves | Do it today |
| DMARC policy in place | Around 54% of senders | Spoofing plus filtering hits | Do it this week |
| DMARC set to enforcement | Many still sit at p=none | Policy exists but does nothing | Do it this month |
| Spam complaint rate | Must stay under 0.3% | Sending privileges throttled | Monitor weekly |
| Inbox placement testing | Only 25% run tests | Blind to real delivery | Add to monthly routine |
| BIMI verified logo | Adoption up around 340% | Lost trust and brand recall | Nice to have, worth it |
| List hygiene and decay | Lists rot near 23% a year | Bounces damage reputation | Quarterly cleanup |
Gmail averages around 95% deliverability. AOL lags near 81%, and Microsoft properties tightened hard on bulk senders.
Then comes a stat that made us wince. Roughly 27% of senders using DMARC cannot say which policy they run. Setting a record and forgetting it helps nobody.
Unsubscribe rates roughly doubled through 2025. Partly that reflects the one click unsubscribe rules, which we genuinely support.
Dude verdict: Deliverability is not sexy, and it beats every clever subject line trick combined. Fix authentication, prune dead subscribers, warm new domains slowly. Boring work, brilliant returns.
AI Sits In The Email Stack, But Daily Use Lags Adoption
Every tool sells AI now. Actual usage tells a calmer story.
Around 63% of marketers use AI somewhere in email. About 79% say they use it or plan to. Yet regular, systematic use sits near 27%.
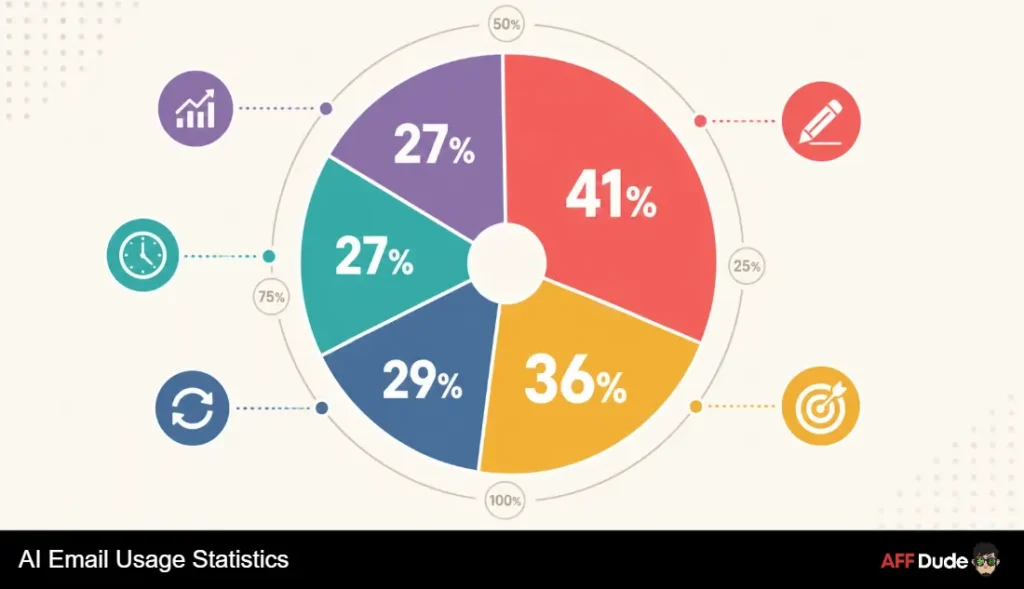
Where AI actually gets used in email during 2026:
Results back the smarter uses. AI-powered email personalisation lifts revenue near 41% and click-through rates around 13.44%.
AI written subject lines beat human versions by roughly 26% on opens. Combine those with send time optimisation and gains stack another 14%.
Speed changed too. About 76% of teams now build and send an email within three days. Two years ago most needed a fortnight.
Advanced AI users report better returns as well. They sit roughly 75% more likely to clear a 45:1 return.
One honest caveat from our side. Teams using AI only for drafting see modest gains at best. Teams wiring AI into segmentation and timing see the real money.
AffDude take: Use AI for the grunt work, keep humans on the offer and angle. We draft with AI, then rewrite every hook by hand. A prompt-shaped email converts like a prompt-shaped email.
Mobile Opens And Design Basics Most Lists Still Fail
Simple section, big consequences. Mobile accounts for around 55% of opens, webmail 26%, desktop 19%.
Apple Mail clients register 51.5% of tracked opens, ahead of Gmail at 26.7%. Outlook takes 7.7% and Yahoo Mail 3.2%.
Now the ugly bit. Only about 47% of companies design fully responsive emails.
So half the market sends desktop layouts into a mobile-first world. Readers spend roughly ten seconds with a brand email, then move on.
What we check before any send goes out:
Video helps too. Emails with video content report far stronger click rates, with some tests showing gains near 96%.
Segmentation And Personalisation Move Revenue More Than Volume
Sending more rarely fixes anything. Sending sharper usually does.
Segmented campaigns generate around 760% more revenue than unsegmented blasts. That figure sounds inflated until you compare a general newsletter with a buyer-only offer email.
Hyper-segmented sends targeting 500 to 2,000 contacts outperform broad segments by roughly 3.4x on conversion rate.
Segmentation splits that earn their keep:
Marketers rank segmentation as their top performing tactic, with 78% naming it most effective. Personalised messaging follows at 72%, then automation at 71%.
First-party audience data matters more each year. Cookies keep shrinking, ad costs keep climbing, and your list keeps working.
AffDude Recommendation: Build one segment this week, not five. Split buyers from browsers and send each group a different offer. That single change lifted revenue per send across every list we manage.
Newsletter Money: What Affiliate Lists Actually Earn
Now for the section our audience asks about most. Affiliate income from email depends far more on engagement than list size.
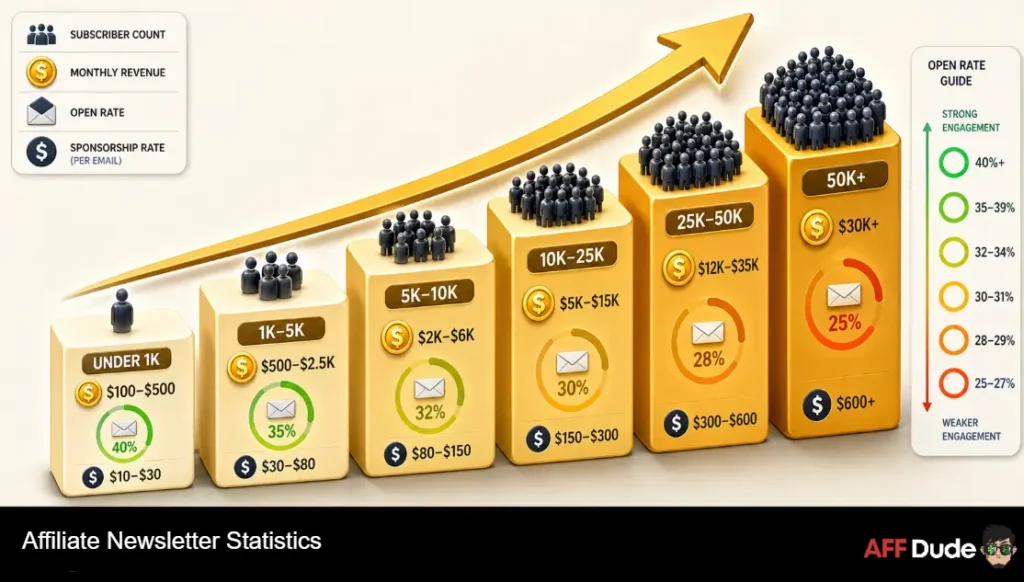
Newsletter CPM rates run from $15 for broad consumer audiences up to $150 for specialist B2B lists. A 10,000 subscriber list with strong opens can command $500 to $1,500 per sponsored issue.
| List size | Typical monthly revenue | Realistic sponsorship rate | Best earning mix | Our comfort benchmark |
|---|---|---|---|---|
| Under 1,000 | $100 to $500 | $25 to $75 per issue | Affiliate links plus digital products | 40% open rate |
| 1,000 to 5,000 | $500 to $2,500 | $75 to $300 per issue | Affiliate offers plus first sponsors | 35% open rate |
| 5,000 to 10,000 | $2,000 to $6,000 | $300 to $800 per issue | Sponsorships plus affiliate stacking | 32% open rate |
| 10,000 to 25,000 | $5,000 to $15,000 | $500 to $1,500 per issue | Sponsors, affiliate, paid tier | 30% open rate |
| 25,000 to 50,000 | $12,000 to $35,000 | $1,200 to $3,000 per issue | Multi-sponsor plus own products | 28% open rate |
| 50,000 plus | $30,000 upward | $2,000 to $7,000 per issue | Ad slots, affiliate, subscriptions | 25% open rate |
Creator platform data backs the trend. Share of newsletter creators earning money doubled from 15% to 30% inside two years.
Subscription income now makes up close to 85% of creator revenue on some platforms, up from about 30%. Median time to a first dollar dropped to 66 days for newer launches.
Free to paid conversion typically runs 1% to 10%, with 3% as a fair benchmark. Cross-newsletter recommendations grow lists roughly 2.75x faster than cold acquisition.
Our honest advice on list monetisation:
Dude debrief: We run The Dude Drop every Tuesday to 94,000 affiliates. Our biggest revenue jumps never came from list growth. They came from cutting dead subscribers and writing to the 20% who actually reply.
Email Versus SMS On Cost, Consent And Conversion
Plenty of affiliates ask which channel deserves budget. Numbers answer clearly.
Email costs roughly $0.0005 to $0.003 per send. US SMS runs $0.007 to $0.015 per message, before carrier and registration fees.
So SMS costs around ten times more per touch. Reach differs too, since only 20% to 40% of an audience opts into texts.
SMS still earns a spot. Text flows produce roughly 8x higher revenue per recipient than SMS blasts, and top campaigns hit 27.5% click rates.
Stores running both channels together see around 30% higher cart recovery than either alone. So pair them, do not pick sides.
Our channel rule stays simple:
Send Timing Data, And Why Most Schedules Are Guesswork
Send time arguments waste more meeting hours than any other email topic. Data settles most of them.
Tuesday holds the top spot for response speed, with Wednesday and Thursday close behind. Late morning slots between 9am and midday still lead on engagement.
Frequency splits the market widely. Around 22% of marketers send two or three messages weekly, while 21% send daily.
What our own send testing keeps showing:
We send The Dude Drop on Tuesday at 9am ET. Not because a study told us to, but because we tested six slots across three years and Tuesday won twice as often.
Tested in-house: Pick a slot, hold it for eight weeks, then judge. Changing your send day every fortnight teaches your list nothing and teaches you less.
Generational Inbox Behaviour Affiliates Keep Getting Wrong
Plenty of marketers assume younger buyers abandoned email. Numbers say otherwise, loudly.
Around 57% of Gen Z say they prefer brands reaching them by email. That group carries buying power near $360 billion.
Roughly 99% of email users check an inbox daily, some as often as twenty times. About 58% open email before touching social feeds or news.
Generational habits worth planning around:
- Younger readers scan faster, so front-load your offer above the fold.
- Older segments read longer and click deeper, which suits comparison content.
- Every age group reads mostly on mobile, so design decisions apply across the board.
So the “email is dead” line stays what it always was. A talking point from people selling something else.
B2B And B2C Email Numbers Split Clearly
Lumping business and consumer email together hides useful signals. Performance separates neatly.
B2B campaigns post click-through rates roughly 47% higher than B2C equivalents. Click-to-open ratios run around 23% stronger too.
About 86% of business professionals prefer email for work communication. Close to 59% of B2B marketers name email their strongest revenue channel.
Consumer lists win on volume and speed instead. Cart recovery, back in stock alerts and birthday offers all belong squarely on the B2C side.
Our own split runs the same way. SaaS and tool offers convert best through longer, proof-heavy sequences. Sweeps and DTC offers need short copy and a fast path to the click.
AffDude Insight: Match sequence length to buying cycle, not to your writing preference. Business buyers want evidence. Consumer buyers want a reason to act today.
Where Most Affiliate Email Programmes Leak Money
Twelve years of running lists teaches you where profit disappears. Same four leaks, almost every time.
Lists decay around 23% a year without cleaning. Dead addresses drag reputation, and reputation decides placement.
Measurement gaps come next. Fewer than half of senders track return properly, so nobody knows which sequence earns most.
Then comes frequency panic. Marketers either send once a month and get forgotten, or blast daily and burn goodwill.
Last comes template neglect. Half the market skips responsive design while most readers sit on phones.
Fix order we recommend, in plain terms:
Hard lesson learned: Every leak above costs money quietly. None of them show up as a dramatic dashboard crash. They just shave 10% here and 15% there until your list feels tired for no obvious reason.
What AffDude Expects From Email Through Late 2026
Here come our own calls. Based on running lists since 2013, plus everything above, this is where we think email lands next.
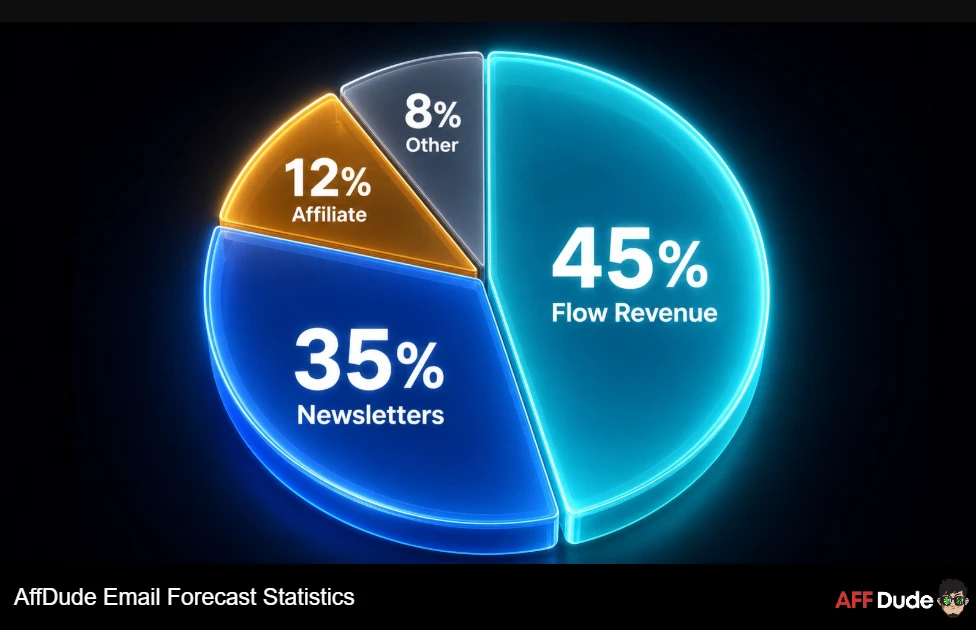
Our forecast for the months ahead:
- Daily volume clears 400 billion messages before 2027 arrives, with AI drafting most of the growth.
- Reported open rates keep inflating, so more teams drop them from client reporting entirely.
- Flow revenue share pushes past 45% as smaller senders finally build sequences.
- AI adoption climbs above 70%, though daily systematic use stays under 40%.
- Authentication becomes a hard gate. We expect unauthenticated inbox placement to fall below 40%.
- Newsletter sponsorship rates soften slightly in broad niches, while specialist affiliate lists hold firm.
We also expect a quiet shakeout among rented audiences. Ad costs keep rising, so more affiliates will treat list building as the primary play rather than an afterthought.
One more call worth writing down. Value per email should clear $0.20 within two years. Better segmentation plus AI timing does that, without sending a single extra message.
Straight talk from the vault: Anyone still measuring email by list size in 2027 will lose to someone measuring by revenue per subscriber. Small, clean and engaged beats big and bloated every time.
Email Marketing Statistics 2026 FAQ
What is the average email marketing ROI in 2026?
Email returns roughly $36 to $42 for every $1 spent. Retail and ecommerce lists average near $45, and top US merchants report up to $68. Paid search returns about $2, so email stays comfortably ahead.
How many emails are sent every day in 2026?
Around 392.5 billion emails move daily across business and personal accounts. That figure grew from 376.4 billion in 2025 and heads toward 424 billion by 2028. Roughly 46.8% of all traffic is spam.
What counts as a good open rate now?
Across industries, 19.2% to 20.7% sits average, though Apple privacy tools inflate reported figures near 33.9%. Anything above 30% looks healthy. Clicks and conversions give a far more reliable read.
Do automated email flows really outperform campaigns?
Yes, and the gap is large. Flows drive close to 41% of email revenue from about 5.3% of sends. Click rates run 5.58% against 1.69% for broadcasts, with far higher order rates.
Which email flow makes the most money?
Abandoned cart sequences lead on revenue per recipient at roughly $3.65. Welcome series follow at $2.65 with the highest open rate near 83.6%. Together with browse abandonment, those three drive about 87% of automated orders.
Is email still worth building for affiliate marketing?
Absolutely. Email converts near 4.24% against 0.59% for social, and costs a fraction of paid traffic. A 1,000 subscriber list with strong engagement can earn from day one through affiliate offers.
How much can a newsletter earn per sponsored issue?
Rates range from $15 CPM for broad consumer lists to $150 for specialist B2B audiences. A 10,000 subscriber list with 35% opens typically commands $500 to $1,500 per issue.
The Bottom Line On Email Marketing Statistics 2026
Pull everything together and one theme repeats. Reach kept growing, measurement got harder, and automation quietly took over revenue.
These Email Marketing Statistics point at a channel that rewards discipline. Authenticate properly. Segment ruthlessly. Build flows before blasts. Report revenue rather than opens.
Do those four things and the averages above stop describing you. You end up on the winning side of every benchmark table instead.
One closing thought from us. The inbox remains the last audience nobody can take away from you, so treat it like the asset it is.
Sources
- Statista – Number of emails sent per day worldwide
- Radicati Group – Email Statistics Report
- Litmus – State of Email and email client market share
- Klaviyo – 2026 email marketing benchmarks
- Omnisend – Ecommerce marketing statistics
- Brevo – Email marketing benchmarks by industry
- HubSpot – State of Marketing report
- Sinch Mailgun – Email Impact Report
- Mailjet – Email marketing trends and deliverability data
- MailerLite – Email marketing benchmarks
- Validity – Email deliverability and sender reputation research
- beehiiv – Creator and newsletter economy reports
- DataReportal – Global digital and internet usage reports
- Mordor Intelligence – Email marketing market size
Recommended Articles

Affiliate Disclosure: This post may contain some affiliate links, which means we may receive a commission if you purchase something that we recommend at no additional cost for you (none whatsoever!)