
Digital marketing in 2026 has turned into a trillion-dollar game. Global ad spend crosses $1 trillion for the first time, and roughly 69% of that cash goes digital. AI now sits inside almost every marketing team. Social media counts 5.79 billion identities. Email still prints the fattest returns.
And Google answers most searches by itself, so free clicks are getting rare. We have pulled the freshest Digital Marketing Statistics into one place, added our own projections, and binned the noise. Want the numbers that actually move your budget? Read on.
AffDude take: We have watched budgets, offers, and traffic sources for years. Our read on 2026 is simple. Money keeps flowing online, but attention is splitting across more apps and AI answers. Spend smart, track everything, and stop chasing cheap clicks.
The Trillion-Dollar Milestone: How Big Digital Really Got
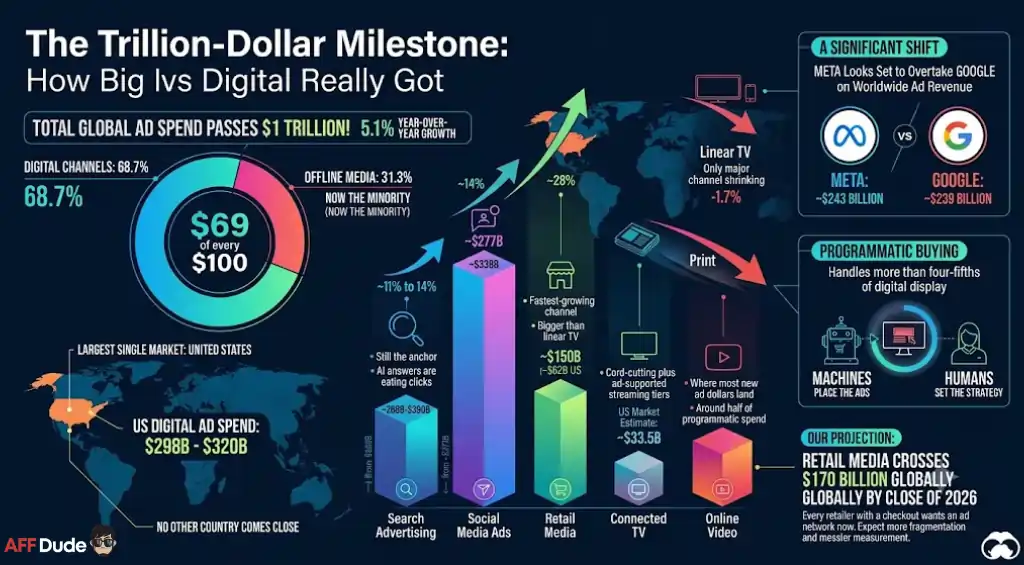
Let us set the scene with a number that reframes everything. Global advertising spend passes $1 trillion in 2026, up around 5.1% on the year before. Digital alone grabs about 68.7% of that pot.
Put another way, close to $69 of every $100 spent on ads now runs through digital channels. Offline media has become the minority side of the business.
The United States stays the biggest single market by a mile. US digital ad spend lands near $298 billion to $320 billion, depending on which model you trust. No other country comes close.
Growth is not even across channels. Retail media, connected TV, and social race ahead. Print keeps sliding.
Here is how the money splits and moves in 2026.
| Channel | 2026 signal | Yearly growth | What it means |
|---|---|---|---|
| Search advertising | Largest digital channel, roughly $268B to $390B | ~11% | Still the anchor, but AI answers are eating clicks |
| Social media ads | ~$277B in 2025, projected ~$338B in 2026 | ~11% to 14% | More than $5 billion a week goes here |
| Retail media | ~$150B global, ~$62B US | ~14% | Fastest-growing channel, bigger than linear TV |
| Connected TV | US market ~$33.5B | ~28% | Cord-cutting plus ad-supported streaming tiers |
| Online video | Around half of programmatic spend | ~11.5% | Where most new ad dollars land |
| Linear TV | Declining | -1.7% | The only major channel shrinking |
One shift worth flagging. Meta looks set to overtake Google on worldwide ad revenue in 2026. Meta reaches around $243 billion against Google near $239 billion.
Programmatic buying now handles more than four-fifths of digital display. Machines place the ads. Humans set the strategy.
Our projection: We reckon retail media crosses $170 billion globally by the close of 2026. Every retailer with a checkout wants an ad network now. Expect more fragmentation and messier measurement before it settles.
AI Went From Toy To Team Member
Two years ago, generative AI in marketing was a side experiment. In 2026, refusing to use it makes you the odd one out.
Adoption tells the whole story. Around 87% of marketers now run generative AI in at least one regular workflow. That figure sat at 51% two years back and 76% last year.
Content teams lead the charge. Nearly all of them, about 94%, plan to use AI for content creation in 2026.
The tool count exploded too. Marketing AI tools grew from roughly 1,200 in 2024 to more than 3,800 in 2026. Tool sprawl is now a real headache.
What do people actually get out of it? Time back, mostly. Marketers save an average of 6.1 hours a week using AI. Senior folk save even more.
Money follows. The global AI marketing market sits near $47 billion in 2026 and keeps climbing fast.
| AI in marketing metric | 2026 figure | Why it matters |
|---|---|---|
| Marketers using generative AI | ~87% (was 51% in 2024) | A 36-point jump in two years |
| Planning AI for content | ~94% | AI writing is now the default, not the edge |
| Weekly time saved | ~6.1 hours | Frees teams for strategy and creative |
| AI marketing tools available | 3,800+ (was 1,200 in 2024) | Choice is huge, focus is hard |
| Enterprise teams running an AI agent | ~34% | Agentic workflows are the next wave |
| Fully trust AI without human checks | ~13% | Most still verify before they publish |
Here is the catch nobody talks about enough. Only around 13% of marketers fully trust AI output without a human review. Speed is easy. Quality control is the real job.
Payback has also sped up. Median return on AI tooling now arrives in about 4.2 months, down from 7.8 months in 2024.
What we reckon: By late 2026, we expect agent adoption in enterprise teams to push past 45%. Media buying, email flows, and social scheduling get handed off first. Governance, sadly, still gets underfunded.
Social Media In 2026: Bigger, Busier, And More Split
Social is not slowing down. It is spreading. People spend the same hours, just across more apps.
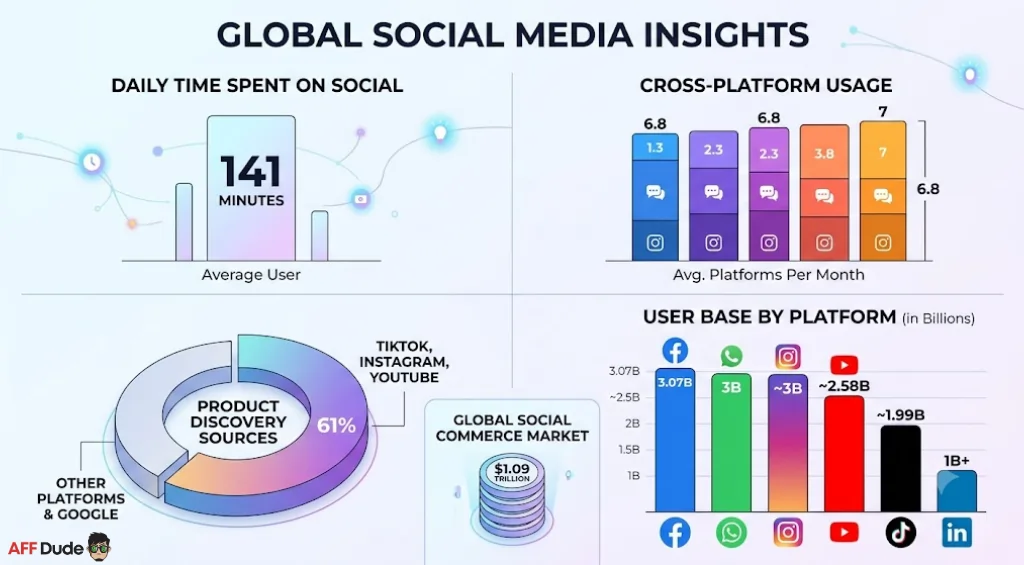
The headline number reframes the rest. Around 5.79 billion social media identities existed by early 2026. That equals roughly 70% of everyone on Earth.
Time spent stays high. The average user gives social media about 2 hours and 21 minutes daily, or close to 19 hours a week.
People also hop around. The typical user moves between roughly 6.75 to 7 platforms every month. One-app strategies miss most of the audience.
Discovery has changed hands too. TikTok, Instagram, and YouTube together drive over 60% of product discovery. Google search share for discovery sits near 34.5%.
Here are the platform sizes that shape your media plan.
| Platform | 2026 reach | Best use for marketers |
|---|---|---|
| ~3.07 billion monthly users | Product discovery, support, retargeting | |
| YouTube | ~2.58 billion ad reach | Long-form proof and how-to content |
| ~3 billion monthly users | Visual commerce and mid-funnel campaigns | |
| ~3 billion users | Direct messaging and follow-up | |
| TikTok | ~1.99 billion monthly users | Impulse discovery and creator selling |
| 1 billion+ members | B2B lead generation, no close second |
Social commerce deserves its own callout. The global market sits near $1.09 trillion. Most in-app buyers never leave the app to purchase.
US social commerce sales should top $122 billion in 2026. TikTok Shop alone is forecast near $23 billion in the US.
Returns hold up nicely. Brands earn roughly $5.20 back for every $1 spent on social and influencer content.
Dude's math: If 5.79 billion identities each give social 19 hours a week, humans burn well over 15 billion hours a day scrolling. Your brand competes with all of it. Front-load value in the first three seconds or lose the view.
Search Is Getting Selfish: Zero-Click And AI Overviews
This section changes how you plan traffic. Google now answers most questions on its own page.
In early 2026, about 68% of Google searches ended without a single click to an outside site. Ten years ago that figure sat near 45%.
The driver is clear. AI Overviews now show up on a large chunk of searches, with tracking figures ranging from 20% to 48% depending on method.
When an AI Overview appears, organic click-through can drop by 34% to nearly 60%. Your ranking can be strong while your traffic quietly falls.
Google AI Mode makes things sharper still. In AI Mode, roughly 93% of queries end with no click. AI Mode has already passed 1 billion monthly users.
Mobile makes it worse. Around 77% of mobile searches end click-free, against about 46% on desktop.
| Search behaviour metric | 2026 figure | Marketer takeaway |
|---|---|---|
| Google zero-click rate | ~68% | Traffic and visibility no longer mean the same thing |
| AI Overview click drop | 34% to 60% | Rankings can rise while clicks fall |
| AI Mode zero-click rate | ~93% | Answer-first search compresses the funnel |
| Mobile zero-click rate | ~77% | Quick answers win on phones |
| Daily Google searches | ~16.4 billion | Demand is huge, capture is harder |
| Commercial queries | Only ~31% zero-click | Buyer-intent pages still earn the click |
Do not panic. There is a safe zone. Transactional and commercial searches still send clicks, because buyers need a site to purchase.
The play now is being cited, not just ranked. Brands mentioned inside AI answers still build awareness. Some data shows cited brands earning meaningfully more downstream clicks.
AffDude call: Shift effort toward product comparisons, reviews, and buyer-intent pages. Keep publishing guides too, because AI answers pull from what ranks well. You feed the machine either way, so at least earn the citation.
Email Still Quietly Wins The ROI Race
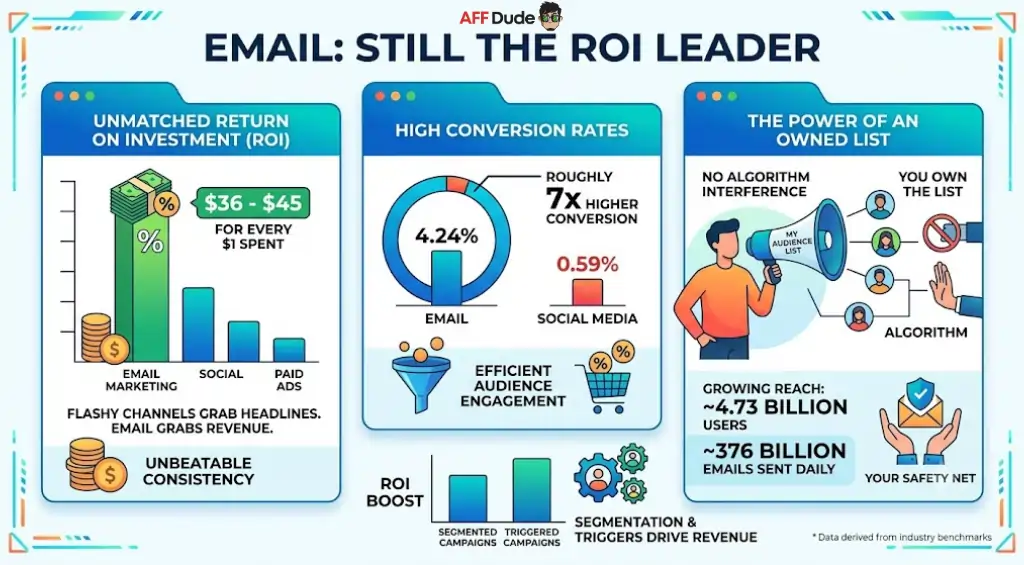
Flashy channels grab headlines. Email grabs revenue.
Return sits around $36 to $45 for every $1 spent. No other channel matches that consistency.
Conversion tells the same tale. Email converts near 4.24%, while social sits closer to 0.59%. That is roughly a 7x gap.
The reason is boring but powerful. You own the list. No algorithm decides who sees your message.
The audience keeps growing. Email users should reach about 4.73 billion in 2026. Around 376 billion emails go out every single day.
Segmentation carries most of the weight. A large share of email revenue comes from segmented and triggered campaigns, not one big blast.
Our estimate: We think mid-2026 sees more brands treating email as their safety net against zero-click search. When Google keeps the click, your owned list becomes the one audience nobody can throttle.
Content And Video: Where Attention Actually Lives
Content marketing keeps earning its keep. It pulls in about 3x more leads than outbound at roughly 62% lower cost.
Average return sits near $7.65 for every $1 spent. SEO-led content stretches even further, with some tracking median returns near 748% over three years for B2B.
The content market itself is massive. Worldwide content marketing revenue reaches about $107 billion in 2026.
Video, though, is the format everyone leans on. Around 91% of businesses use video as a marketing tool. About 93% call it an important part of their strategy.
Short-form clips lead on returns. Marketers rank short-form video as their top ROI content format, ahead of long-form and live.
Buyers agree. Roughly 73% of consumers prefer a short video to learn about a product.
| Content and video metric | 2026 figure | Action for marketers |
|---|---|---|
| Leads vs outbound | 3x more, 62% cheaper | Owned content beats cold outreach on cost |
| Average content ROI | ~$7.65 per $1 | Treat content like a compounding asset |
| Businesses using video | ~91% | Video is table stakes, not a bonus |
| Top ROI format | Short-form video | Prioritise clips on social feeds |
| TikTok ad revenue | ~$44 billion projected | Creator-led video keeps scaling |
| Video marketers using AI | ~63% | AI editing cuts production time and cost |
TikTok keeps its grip on video ad money. Projections put its 2026 ad revenue near $44 billion, with a shot at 40% of global video ad revenue by 2027.
One quiet trend worth noting. Average blog length dropped for a second straight year, sitting near 1,350 words in 2025. Tighter, sharper content is winning.
AffDude take: Repurpose one strong idea into a short video, a blog, and an email. Content that travels across formats returns more per hour of work. We have seen repurposing lift output value by roughly a third.
Influencer Marketing: Trust Beats Polish
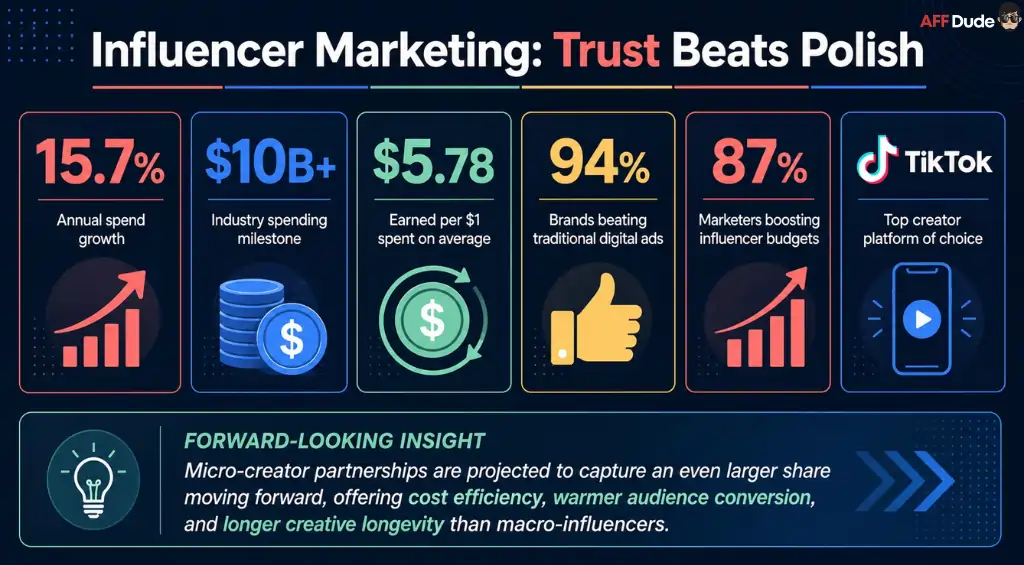
People trust people more than logos. That single idea powers the whole channel.
US influencer marketing spend grew around 15.7% in 2026. Spend passed $10 billion the year before.
Returns hold strong. Influencer campaigns average roughly $5.78 back for every $1 spent.
Confidence is high across the board. A large majority of organisations, around 94%, say influencer marketing beats traditional digital ads.
Budgets keep rising. Close to 87% of marketers plan to grow influencer spend in 2026.
TikTok stays the favourite home for creators, used by a big share of brands running influencer programmes.
Our projection: We expect micro-creator deals to grab an even bigger slice by year-end. Smaller creators cost less, convert warmer audiences, and dodge creative fatigue longer. Track them with promo codes and proper links, not vibes.
Mobile First, Or Miss Most Of The Market
Phones run modern marketing. Ignore mobile and you lose the bulk of your audience before the message lands.
Mobile takes over half of digital ad budgets, sitting near 54%. Some models put mobile even higher.
Usage backs it up. The average US user spends about 4.5 hours a day on a mobile device.
Mobile also drives that zero-click behaviour we covered earlier. Quick answers on small screens keep people on the results page.
So the checklist is blunt. Fast load times. Thumb-friendly layouts. Click-to-call ready. Test checkout on a phone before you scale anything.
Channel ROI Face-Off: Where Your Next Pound Works Hardest
Budgets are tight and bosses want proof. Roughly 83% of marketing leaders now name proving ROI as their top pressure.
So here is a clean comparison. These are the returns marketers report across major channels in 2026.
| Channel | Reported return per $1 | Best fit |
|---|---|---|
| Email marketing | ~$36 to $45 | Owned audiences and repeat sales |
| SEO and content | ~$22, or 748% over 3 years | Long-term, compounding growth |
| Influencer marketing | ~$5.78 | Trust-led awareness and conversion |
| Social media ads | ~$5.20 | Discovery and mid-funnel reach |
| Google Ads | ~$2 to $8 | Fast, buyer-intent traffic |
A pattern jumps out. Owned channels, email and SEO, return the most over time. Paid channels return fast but flat.
Around 49% of marketers say organic search still delivers their best overall ROI. Website, blog, and SEO content sit at the top of many ROI rankings.
Dude's rule: Build owned assets first. Use paid to top up while your list and rankings grow. We have seen too many brands rent all their traffic, then panic when costs jump or an algorithm shifts.
What We Reckon For The Rest Of 2026
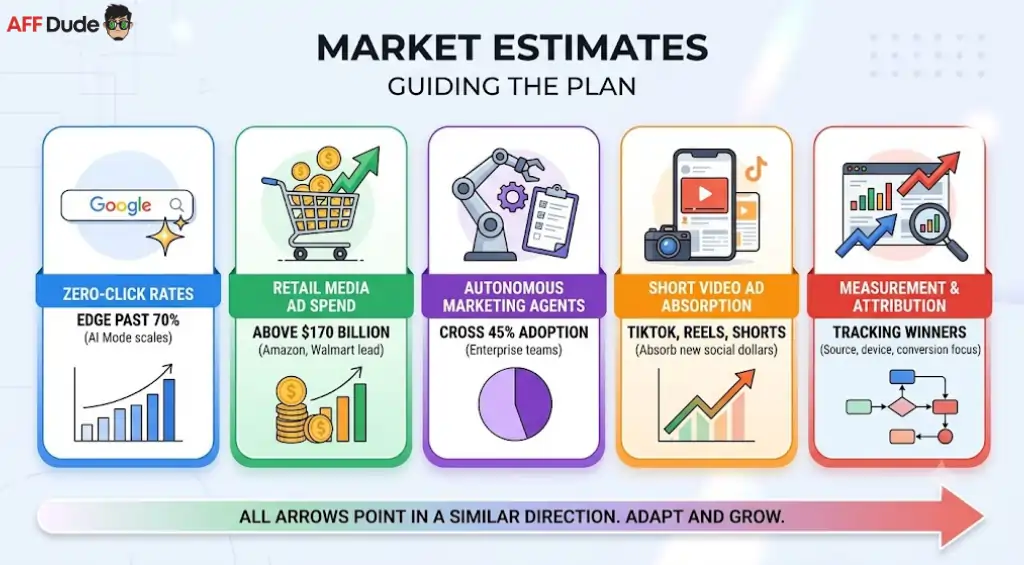
Time for our own calls. These are estimates from watching the market, not gospel.
None of these need to be perfectly right to guide a plan. The direction is what matters, and every arrow points the same way.
The Bottom Line
Digital marketing in 2026 rewards focus, not noise. Money keeps pouring online, AI runs through every team, and social media keeps splitting attention across apps.
Meanwhile, search hoards clicks, so owned channels like email and content matter more than ever. Track everything, build assets you control, and let paid top up the tank.
Use these Digital Marketing Statistics to plan with proof, not guesswork. That is the whole game now.
Sources
We pulled these numbers from trusted research bodies and industry reports. Check them for the full detail.
- Statista, Advertising Market Worldwide
- dentsu, Global Ad Spend Forecasts 2026
- HubSpot, State of Marketing 2026
- Sprout Social, Social Media Statistics 2026
- DataReportal, Digital 2026 Global Overview
- SparkToro, Zero-Click Search Study 2026
- Search Engine Land, Search and AI Overview Data
- Litmus, State of Email 2026
- Wyzowl, Video Marketing Statistics 2026
- Content Marketing Institute
- eMarketer, Digital Ad Spend Forecasts
Recommended Articles

Affiliate Disclosure: This post may contain some affiliate links, which means we may receive a commission if you purchase something that we recommend at no additional cost for you (none whatsoever!)