
TikTok is not just a social app anymore. It is a search engine, a shopping mall, and an advertising powerhouse rolled into one. In 2026, TikTok has reached 1.92 billion monthly active users, generates an estimated $32.8 billion in revenue, and its shopping feature alone is projected to hit $84.3 billion in GMV. No other platform is growing at that speed across users, revenue, and commerce simultaneously.

For marketers building campaigns, allocating budgets, or pitching TikTok to clients, you need hard TikTok statistics—not opinions or hunches.
If you are planning a TikTok marketing strategy for 2026, these statistics cover everything from user growth and demographics to TikTok advertising benchmarks and influencer ROI.
📈 TikTok Statistics: User Growth Trends 2026
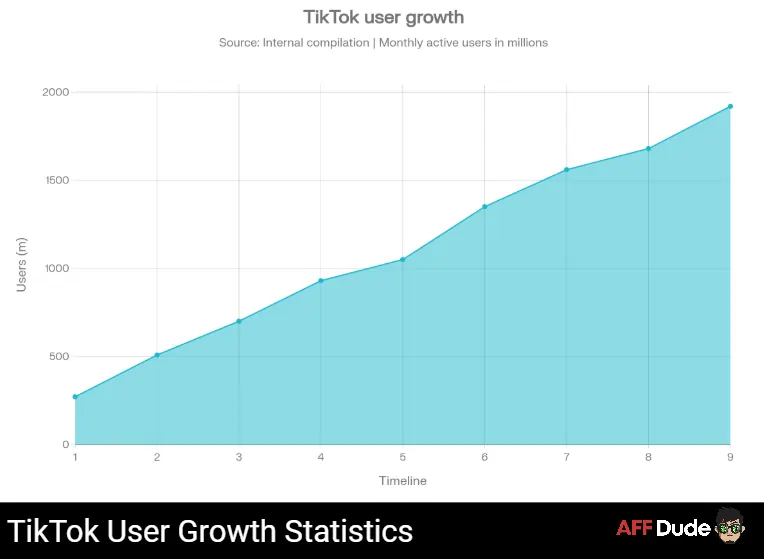
TikTok's growth has been extraordinary. From 271 million users in 2018 to nearly 2 billion in 2026, it is a sevenfold increase in eight years.
| Year | Monthly Active Users | YoY Growth |
|---|---|---|
| 2018 | 271 million | — |
| 2019 | 508 million | +87.5% |
| 2020 | 700 million | +37.8% |
| 2021 | 930 million | +32.9% |
| 2022 | 1.05 billion | +12.9% |
| 2023 | 1.35 billion | +28.6% |
| 2024 | 1.56 billion | +15.6% |
| 2025 | 1.68 billion | +7.7% |
| 2026 | 1.92 billion | +14.3% |
Growth rebounded in 2026 after a brief slowdown, proving TikTok's ability to sustain momentum despite regulatory pressure and competition from Instagram Reels and YouTube Shorts.
📱 TikTok Download Statistics by Region
TikTok continues to attract millions of fresh installs across every major market.
Regional User Distribution (2026)
| Region | Users (Millions) | Share | YoY Growth |
|---|---|---|---|
| Asia-Pacific | 1,124 | 58.5% | 16.2% |
| Europe | 289 | 15.1% | 11.7% |
| North America | 192 | 10.0% | 8.4% |
| Latin America | 187 | 9.7% | 19.8% |
| Middle East & Africa | 128 | 6.7% | 23.4% |
Asia-Pacific accounts for nearly 6 in 10 TikTok users. But Middle East and Africa show fastest growth at 23.4%, and Latin America follows at 19.8%. For brands running TikTok campaigns in emerging markets, these regions represent massive untapped audiences
👥 TikTok User Demographics 2026
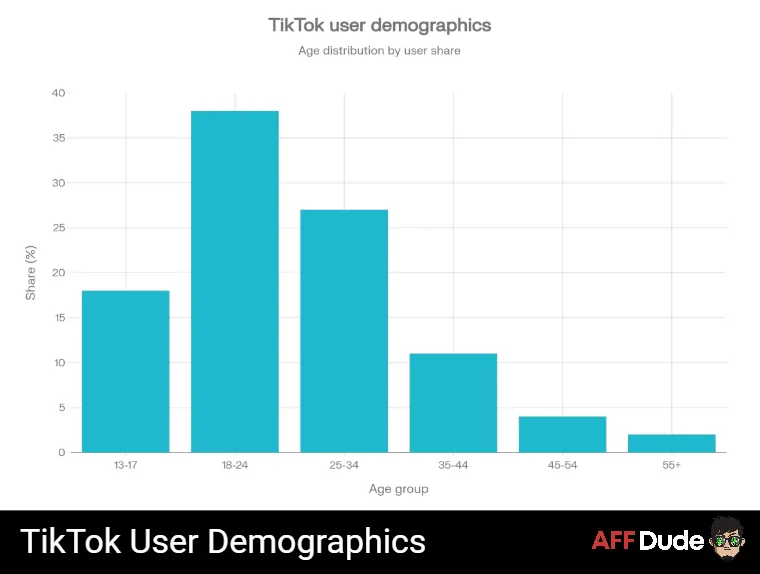
Knowing who uses TikTok helps you build smarter creatives and sharper audience targeting on TikTok.
Age Distribution
| Age Group | Share of Users | Total Users (Millions) |
|---|---|---|
| 13–17 | 18% | 346 million |
| 18–24 | 38% | 730 million |
| 25–34 | 27% | 518 million |
| 35–44 | 11% | 211 million |
| 45–54 | 4% | 77 million |
| 55+ | 2% | 38 million |
Gender Split
Income Distribution (US)
| Household Income | Share of US TikTok Users |
|---|---|
| $100K+ | 42% |
| $50K–$100K | 38% |
| Below $50K | 20% |
TikTok reaches affluent, educated audiences despite being perceived as a teen platform. 42% of US TikTok users earn over $100K annually, making it a strong channel for premium brands.
💬 TikTok Engagement Statistics 2026
Engagement is where TikTok crushes every competitor. Algorithm-driven content discovery keeps users hooked longer and interacting more.
Engagement Benchmarks (2026)
| Metric | Benchmark |
|---|---|
| Overall engagement rate | 3.85%–4.90% |
| Small accounts (<5K) | 4.20% |
| All brands average | 3.85%–4.10% |
| TikTok ads CTR | 0.84% |
| E-commerce conversion rate | 0.46% |
For marketers measuring TikTok engagement rate benchmarks, anything above 5% signals strong performance. Smaller accounts consistently outperform larger ones because the algorithm favours authentic, niche content over follower count.
💰 TikTok Revenue and Monetisation Stats 2026
TikTok's revenue machine runs on three engines: advertising, in-app purchases, and e-commerce. All three are growing fast.
| Year | Total Revenue | YoY Growth |
|---|---|---|
| 2022 | $9.4 billion | — |
| 2023 | $16.1 billion | +71% |
| 2024 | $23.6 billion | +42.8% |
| 2025 | $33.1 billion | +40.5% |
| 2026 (Projected) | $32.8–$44 billion | +32.7% |
| 2027 (Projected) | $45.2–$54 billion | +22.7% |
Revenue Breakdown (2026)
US generates disproportionate revenue despite having just 10% of users. For marketers allocating TikTok advertising budgets, the US market delivers highest revenue per user.
📣 TikTok Advertising Statistics 2026
TikTok's ad platform has matured rapidly. Costs remain competitive, and reach keeps expanding.
TikTok Ad Creative Best Practices (Stats-Backed)
For marketers debating where to spend, TikTok offers one of the lowest CPMs among major social platforms while delivering strongest engagement rates. That combination is hard to beat.
🛒 TikTok Shop and Social Commerce Stats
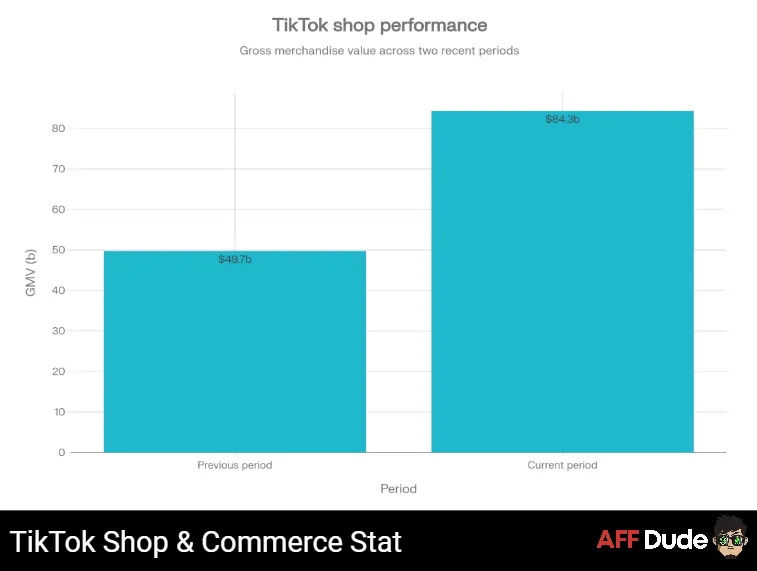
TikTok Shop is the platform's breakout revenue story. From product discovery to checkout, everything happens inside the app.
| Metric | 2025 | 2026 (Projected) |
|---|---|---|
| TikTok Shop GMV | $49.7 billion | $84.3 billion |
| Growth rate | — | +69.6% |
| Active merchants | 6.7 million | Growing |
| Products available | 234,000+ | Growing |
For e-commerce brands, TikTok Shop marketing is arguably the biggest social commerce opportunity in 2026. At nearly $84 billion in projected GMV, it rivals some traditional e-commerce platforms in scale.
🤝 TikTok Influencer Marketing Statistics 2026
TikTok delivers the highest influencer marketing ROI among all social platforms. Engagement rates and conversion potential are unmatched.
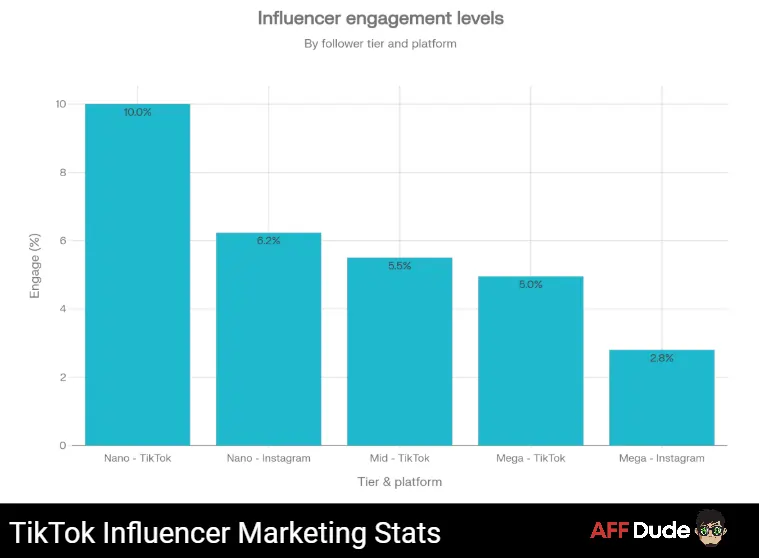
Influencer Engagement by Follower Size
| Follower Tier | Platform | Engagement Rate |
|---|---|---|
| Nano (<10K) | TikTok | ~10%+ |
| Nano (<10K) | 6.23% | |
| Mid (100K–500K) | TikTok | ~5%–6% |
| Mega (1.5M+) | TikTok | 4.95% |
| Mega (1.5M+) | 2.80% |
Nano-influencers consistently outperform mega-influencers on engagement. For brands focused on TikTok creator partnerships, working with smaller creators often delivers better results per dollar spent.
TikTok vs Other Platforms: Quick Comparison
Here is how TikTok stacks up against major competitors in 2026:
| Metric | TikTok | YouTube | ||
|---|---|---|---|---|
| Monthly Active Users | 1.92B | 3B | 2.58B | 3.07B |
| Daily Active Users | 1.12B | 1.28B | 1.89B | 2.11B |
| Avg. Engagement Rate | 3.85%–5.3% | 0.45% | ~1.5% | ~0.15% |
| Avg. Daily Time Spent | 95 mins | 33 mins | 48 mins | 30 mins |
| YoY User Growth | +14.3% | +6.7% | +4.2% | +2.8% |
| Ad CPM | $9.16 | $11.50 | $12.00 | $8.50 |
TikTok wins on engagement rate and daily time spent by a wide margin. Instagram and YouTube lead in raw user numbers, but neither matches TikTok's ability to keep audiences scrolling and interacting.
🔮 TikTok Growth Projections: 2027 and Beyond
Based on current momentum, TikTok shows no signs of slowing down.
Recommended Articles
Why Marketers Cannot Ignore TikTok in 2026
TikTok has evolved from a lip-syncing app into a full-funnel marketing platform. With 1.92 billion users, 95 minutes of daily engagement, $84 billion in projected shop GMV, and engagement rates 8x higher than Instagram, the platform offers what every marketer wants: attention that converts.
Ad costs remain lower than Facebook and YouTube. Organic reach still rewards small creators. And TikTok social commerce is growing at nearly 70% annually. For any brand selling to audiences under 45, TikTok should no longer be an experiment. It should be a core budget line 🚀.