Coupons are no longer just paper clippings from Sunday newspapers. In 2026, digital coupon marketing drives billions in revenue, shapes buying decisions, and fuels customer loyalty across every major industry.
With over 90% of consumers actively using coupons during purchases, ignoring coupon data means leaving money on a table.
The global digital coupon market now sits at approximately $12.59 billion in 2026, growing at a rapid CAGR of 19.16%. For marketers, understanding coupon statistics is not optional anymore. It is essential for building smarter campaigns, boosting conversions, and winning new customers.
Here is everything you need to know about coupon usage, redemption trends, market growth, and consumer behaviour in 2026 and beyond.
💰Coupon Market Size and Growth in 2026
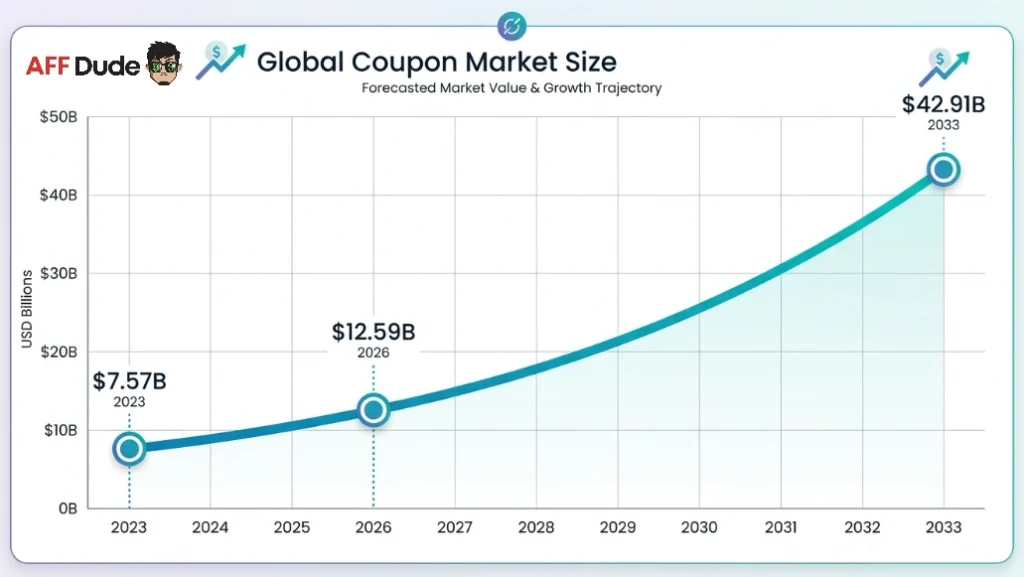
The coupon market has seen explosive growth over recent years. In 2024, it was valued at $8.87 billion. By 2025, it climbed to roughly $10.57 billion. And in 2026, estimates place it at $12.59 billion.
Looking ahead, projections show a market reaching $42.91 billion by 2033, driven by a compound annual growth rate (CAGR) of 19.16%.
Here is how market size is expected to grow year by year:
| Year | Market Size (USD) |
|---|---|
| 2023 | $7.57 billion |
| 2024 | $8.87 billion |
| 2025 | $10.57 billion |
| 2026 | $12.59 billion |
| 2027 | $15.01 billion |
| 2028 | $17.89 billion |
| 2030 | $25.39 billion |
| 2033 | $42.91 billion |
The digital coupons market (including mobile and app-based) was estimated at $109.38 billion in 2024 and is projected to reach $250.91 billion by 2035, exhibiting a CAGR of 7.84%.
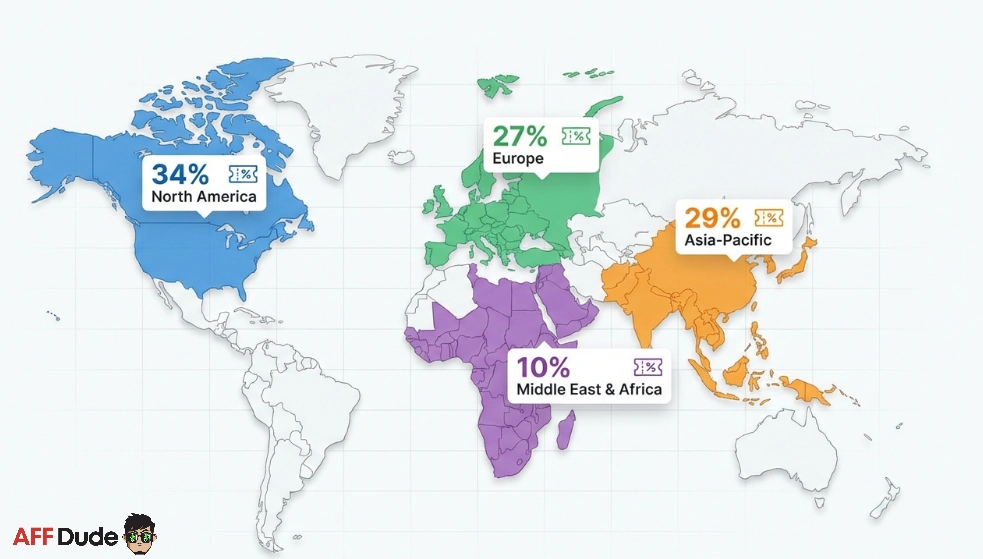
Regional Coupon Market Share Breakdown 🌍
North America leads global coupon adoption with over 34% of total market share, followed closely by Asia-Pacific at 29%.
| Region | Market Share |
|---|---|
| North America | 34% |
| Asia-Pacific | 29% |
| Europe | 27% |
| Middle East & Africa | 10% |
Key regional highlights include:
How Many People Use Coupons in 2026? 🛒
As of 2026, roughly 90% of consumers have used coupons while shopping. That means 9 out of 10 people actively look for savings before completing a purchase.
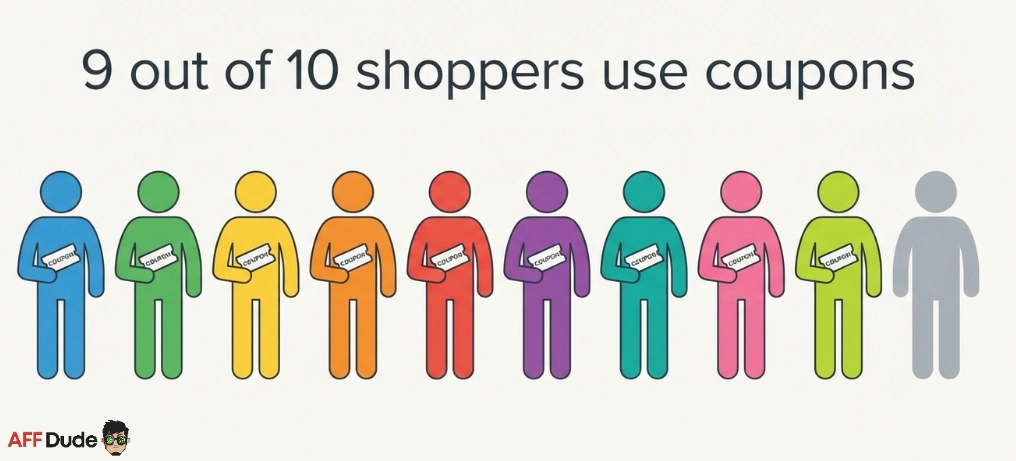
In America alone, 93% of consumers use coupons or have used one in recent years. An estimated 169.2 million American consumers redeemed digital coupons in 2025, and numbers continue to climb.
Here are some standout usage stats:
Coupon Redemption Rate Statistics 📈
A digital coupon redemption rate has steadily improved. In 2023, coupon redemption rates increased by 10.4% from 2022, marking a first rise since 2008.
In 2024, Americans redeemed 871 million coupons total. Of those, 465.5 million were digital coupons, up 10.8% from 420.2 million in 2023. Meanwhile, 355.3 million traditional paper coupons were redeemed.
| Coupon Type | Share of Redemptions |
|---|---|
| Digital Coupons | 33.3% |
| Free-Standing Inserts | 24.2% |
| Instant Redeemable Coupons | 15.3% |
| Other | 27.2% |
More key redemption facts:
📱Mobile Coupon Market and Smartphone Usage
Mobile is where coupon activity truly dominates. A global mobile coupon market was valued at $727.3 billion in 2024, up 15.4% year-over-year. It is projected to reach $1.6 trillion by 2030, at a CAGR of 14.6%.
In America specifically, a mobile coupon market was valued at $199 billion in 2024, up 14% year-over-year.
Smartphone usage for coupon redemption keeps climbing:
| Year | Smartphone Users (%) | Tablet Users (%) |
|---|---|---|
| 2022 | 91.5% | 42.2% |
| 2023 | 92.3% | 42.1% |
| 2024 | 93.0% | 42.0% |
| 2025 | 93.5% | 41.9% |
| 2026 (Est.) | 93.8% | 41.9% |
About 93.5% of digital coupon users redeem coupons with a smartphone, while only 41.9% use tablets. Mobile coupons are redeemed 10 times more often than traditional paper.
✂️ Digital Coupons vs Paper Coupons
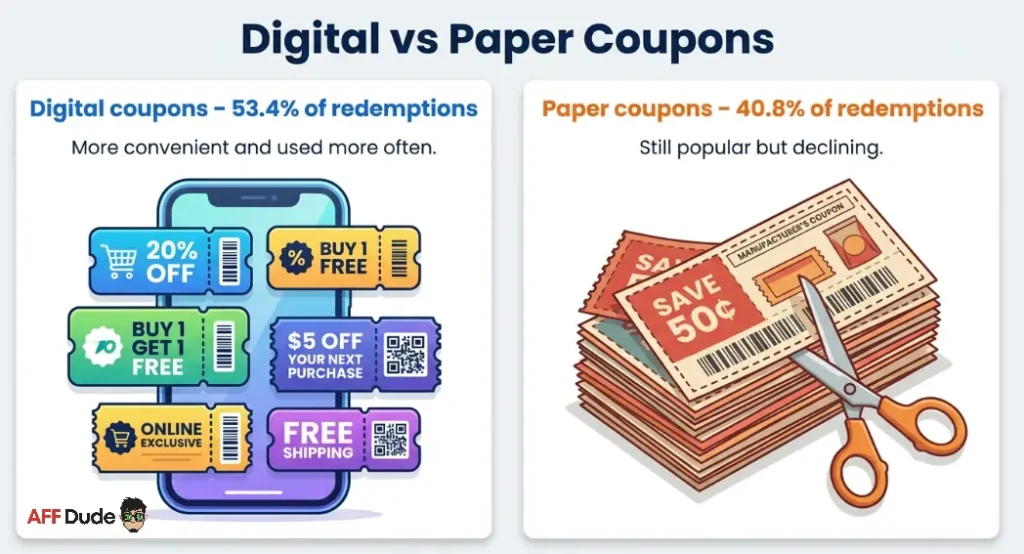
A clear shift from paper to digital is well underway. In 2024, 53.4% of all coupons redeemed were digital, while 40.8% were clipped from traditional printed sources.
Paper coupon usage is declining. Physical coupon redemptions fell by 5.61% in 2024 and by 6.88% in 2023.
👥 Consumer Demographics and Coupon Behaviour
Millennials are most responsive to coupon offers, with 89% saying they would try a new brand if offered a discount.
| Generation | Would Try a New Brand with a Coupon |
|---|---|
| Millennials | 89% |
| Gen X | 86% |
| Gen Z | 78% |
| Baby Boomers | 76% |
Age-Based Digital Coupon Usage
Adults aged 35 to 54 show highest digital coupon usage at 99%, followed by 96% among people aged 55 and above.
| Age Group | Digital Coupon Usage |
|---|---|
| 18 to 34 years | 81% |
| 35 to 54 years | 99% |
| 55+ years | 96% |
Generational Preference for Coupon Format
| Generation | Digital Coupons | Paper Coupons |
|---|---|---|
| Millennials | 70% | 30% |
| Gen Z | 62% | 38% |
| Gen X | 61% | 39% |
| Baby Boomers | 44% | 56% |
| Silent Generation | 11% | 89% |
About 85.5% of Gen Z shoppers wait for coupon code offers before making purchases. In 2024, 78% of Gen Z consumers redeemed digital coupons, while 65% used paper ones.
🔍 How Consumers Find Coupons Online?
Brand emails remain a top source for coupon code discovery, with 47% of consumers finding coupons through promotional emails.
| Coupon Source | % of Consumers |
|---|---|
| Personal emails from brands | 47% |
| Online searches | 46% |
| Coupon websites | 34% |
| Coupons from previous purchases | 33% |
| Deal aggregators | 28% |
| Mail catalogues or flyers | 22% |
| Social media posts from brands | 21% |
| Browser extensions | 21% |
| Paid social media ads | 16% |
| Influencers on social media | 13% |
On social media, Facebook leads coupon discovery at 42%, followed by Instagram at 30% and YouTube at 25%.
79% of consumers are willing to provide an email address in exchange for a digital coupon. Meanwhile, 34% of consumers spend 5 to 10 minutes searching for coupons online before buying.
Impact of Coupons on Shopping Behaviour 🧠
Coupons heavily influence buying decisions. A remarkable 83% of shoppers say coupons influence purchase decisions.
Retailers see a 50% increase in conversions when they offer coupons. People who use coupons spend, on average, 24% more per shopping trip compared to non-coupon users.
Watch: How Coupon Codes Actually Work (Explainer)
Consumer Savings from Coupons 💵
An average American household saves up to $1,465 annually by using digital coupons across everyday purchases.
| Spending Category | Average Yearly Savings |
|---|---|
| Groceries (Food at Home) | $316 |
| Household Items | $272 |
| Dining Out | $264 |
| Automotive Expenses | $138 |
| Apparel & Accessories | $135 |
| Personal Care & Beauty | $66 |
| Alcohol | $47 |
| Travel | $37 |
35% of consumers save between $10 and $25 per month using digital coupons. Only 4% manage to save over $100 monthly.
🏆Top Coupon Websites and Platforms
Globally, Rakuten leads coupon website traffic with 12.39% of all visits. Slickdeals follows at 9.57%, and Capital One Shopping holds 8.22%
| Coupon Website | Share of Global Visits |
|---|---|
| Rakuten.com | 12.39% |
| Slickdeals.net | 9.57% |
| CapitalOneShopping.com | 8.22% |
| LinksPRF.com | 2.61% |
| JoinHoney.com | 2.54% |
Among coupon aggregators, Honey leads with 29% regular usage, followed by RetailMeNot at 28%, and Rakuten and Coupons.com tied at 21%.
Major players in a broader coupon industry include Amazon, Kroger, Groupon, Rakuten, and Honey. On Amazon alone, sellers report that about 50% of customers use coupons when one is offered. Kroger customers clipped 4 billion digital coupons in 2023, a 1 billion increase from 2022.
🎟️Preferred Coupon Types Among Consumers
“Percentage off” deals remain most popular, chosen by 67% of consumers.
| Coupon Type | Consumer Preference |
|---|---|
| Percentage off | 67% |
| Buy One, Get One Free (BOGO) | 61% |
| Free shipping | 57% |
| Fixed amount off | 48% |
85% of consumers use a digital coupon within one week of receiving it, and 30% redeem it on same day. Half of users found that online coupon codes were valid only 10 to 50% of attempts, while just 9% reported a 90%+ success rate.
⚠️ Key Challenges Facing Digital Coupons
Despite rapid growth, a digital coupon industry faces real obstacles around data privacy and user experience.
| Challenge | Percentage Affected |
|---|---|
| Consumers worried about data tracking | 62% |
| Users unwilling to share personal data | 48% |
| Mobile app users opting out of promo notifications | 41% |
| Marketers facing platform fragmentation | 57% |
| Users abandoning coupons due to redemption issues | 43% |
| Consumers receiving expired or non-functional coupons | 39% |
About 62% of consumers are uncomfortable with apps tracking behaviour for targeted coupon offers. And 43% of users give up on digital coupons because redemption processes are confusing at checkout.
🔮 What 2026 and Beyond Looks Like for Coupons?
A coupon industry is on an upward path with no signs of slowing down. As e-commerce discount code usage grows and mobile adoption increases, marketers who integrate coupons into campaigns will see stronger engagement and higher conversion rates.
For any marketer reading coupon statistics in 2026, one message is clear: coupons work, consumers expect them, and brands that offer smart, personalised discounts will win more sales and loyalty in years ahead.